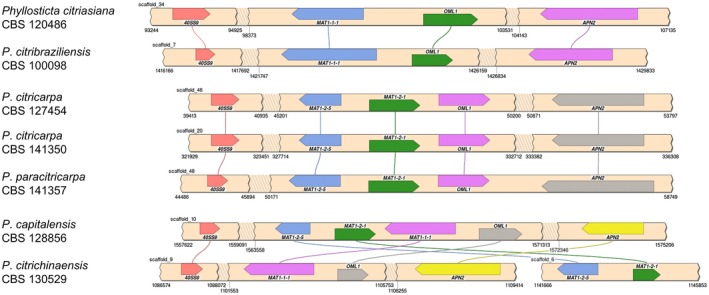
Figure 4.

Syntenic relationships between mating type loci in different species of Phyllosticta. For each genome, the regions of the scaffolds containing mating type genes are illustrated as beige strips. Shaded breaks in the strips indicate larger genomic regions that do not contain our mating type genes, which are not visualized for clarity and brevity. The scaffold numbers and the relevant positions are annotated. Coloured boxes on the scaffolds indicate mating type genes, and the pointed end refers to the 3' end of the gene. Boxes with the same colour indicate the same mating type gene. Lines link the boxes to indicate their positions in the different genomes. Together, this figure visualizes the rearrangement of mating type loci across the Phyllosticta genomes.
