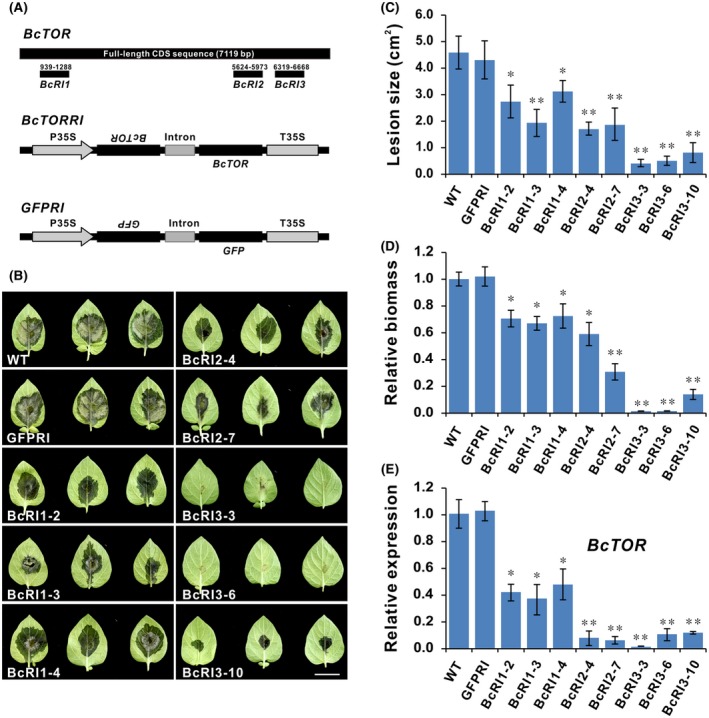
Figure 7.

Transgenic potato expressing BcTOR dsRNA shows enhanced resistance to Botrytis cinerea. (A) Schematic diagram of RNA interference vector targeting BcTOR and GFP (control). (B) Infection phenotype of B. cinerea on detached leaves of transgenic potato lines and wild‐type (WT). Photographs were taken at 3 days post‐inoculation. Scale bar represents 2 cm. (C, D) Infection lesion size and relative biomass of B. cinerea. Error bars indicate the SEM (n ≥ 20). The experiments were repeated three times. (E) Relative expression level of BcTOR in B. cinerea during infection of transgenic and WT potato plants. Data are represented as means ± SD (n = 3). *P < 0.05, **P < 0.01 (Student’s t‐test).
