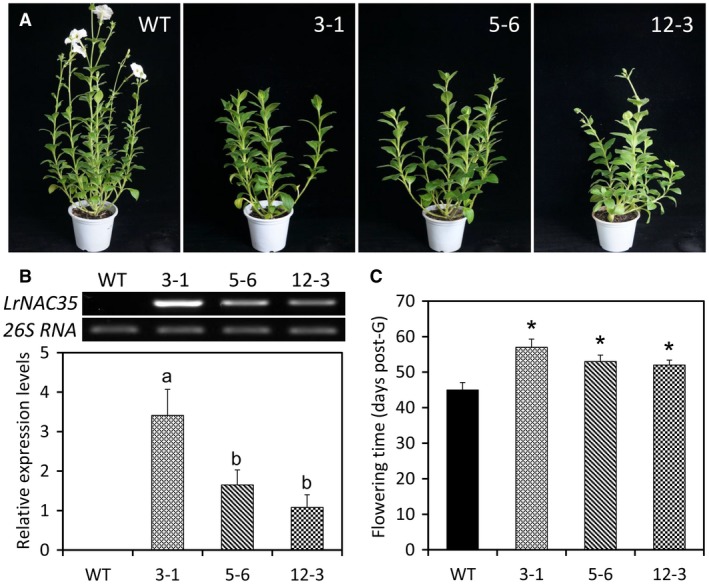
Figure 5.

Impact of LrNAC35 overexpression on flowering time of transgenic petunia plants. (A) Representative growth phenotypes of wild‐type (WT) and LrNAC35‐overexpressing lines (3‐1, 5‐6 and 12‐3) at 8 weeks post‐germination. (B) Semiquantitative RT‐PCR and qRT‐PCR analyses of LrNAC35 transcript abundances in the leaves of WT and transgenic petunia lines overexpressing LrNAC35. 26S rRNA was used as a normalization control. Error bars represent SE of the mean from three biological replicates. Significance of difference was evaluated using one‐way ANOVA test (P < 0.05) and shown as various letters. (C) Flowering time of transgenic petunia plants overexpressing LrNAC35 post‐germination (post‐G) compared to WT plants. Five independent plants for each line were used for the analysis of flowering time. Asterisks denote significant difference based on calculation by Student's t‐test at P < 0.05.
