
Figure 1.
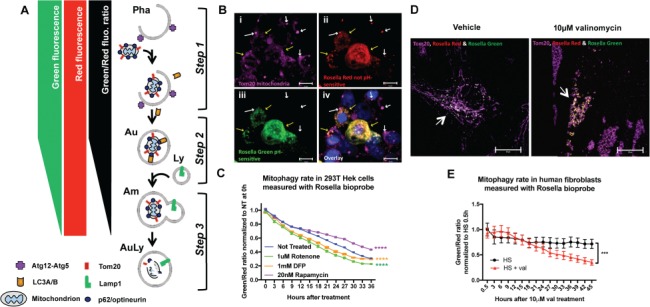
Validation of methodology to measure mitophagic flux using Rosella biosensor. (A) Schematic representation of the Rosella fluorescence output: Step 1. As the mitochondria enter the mitophagic pathway, they are associated with phagophore formation before being enclosed into an autophagosome that matures and eventually fuses with a lysosome. Step 2. During maturation, the autophagic vesicle will undergo acidification. As the pH changes from high mitochondrial pH ~8.2 to the more acidic pH, green fluorescence decreases while red fluorescence is unaffected, lowering the Rosella green signal and thus decreasing the Rosella green/red ratio. Step 3. After the lysosomal fusion, the pH drops to ~5.5, quenching the green fluorescence and bringing the green/red ratio down. Eventually, with full mitochondrial protein degradation, the red fluorescence also decays. Pha: phagophore, Au: autophagosome, Am: amphisome; Ly: lysosome; AuLy: autolysosome. (B) Confocal Z-stack maximal projection (at 100× magnification) of a Rosella transfected 293T cells treated with 1 μM rotenone for 24 h. Yellow arrows point to Tom20 labeled mitochondria (purple, i) transfected and expressing both Rosella red (ii) and green (iii). White arrows pointing to Tom20+ (purple, i) and only Rosella red positive (ii) mitochondria, most probably localized in an acidic low pH environment such as the autophagosome on its way to final degradation in the lysosome. Blue labels nuclear Hoechst staining (iv). (C) Live cell imaging in human 293T HEK cells transfected with the lentivirus-CMV driven Rosella bioprobe and 48 h later treated with 1 μM rotenone, complex I blocker consequently inducing mitochondrial damage, 20 nm rapamycin, an autophagy inducer, and 1 mM DFP, mitophagy inducer. Cells were imaged using live cell IncuCyte imaging system every 3 h immediately after compound application. Two-way ANOVA shows a significant difference in the green/red ratio levels between the non-treated cells and rotenone, rapamycin and DFP treated cells (P<0.0001, F(4, 975) = 970, with Dunnett’s post hoc multiple testing correction). (D) Confocal Z-stack maximal projection (at 100× magnification) of Rosella transduced human fibroblasts (HS21) treated with Dimethyl sulfoxide (DMSO) or 10 μM valinomycin, a mitochondrial depolarizing agent, for 24 h. Arrows point to Rosella transfected (green and red) fibroblasts co-stained with Tom20 to label the mitochondrial networks (purple). Upon 10 μM valinomycin treatment, these networks are visibly fragmented. (E) Live cell imaging of human fibroblasts infected with the lentivirus CMV-driven Rosella bioprobe and treated with DMSO or 10 μM valinomycin. Cells were imaged using live cell IncuCyte imaging system every 3 h immediately after compound application. Two-way ANOVA shows a significant difference in the green/red ratio levels between the vehicle-treated and valinomycin-treated cells (P<0.0004, F(1, 314) = 13.05). Error bars represent standard error of the mean [(SEM); P<0.001 ***, P<0.0001 ****].