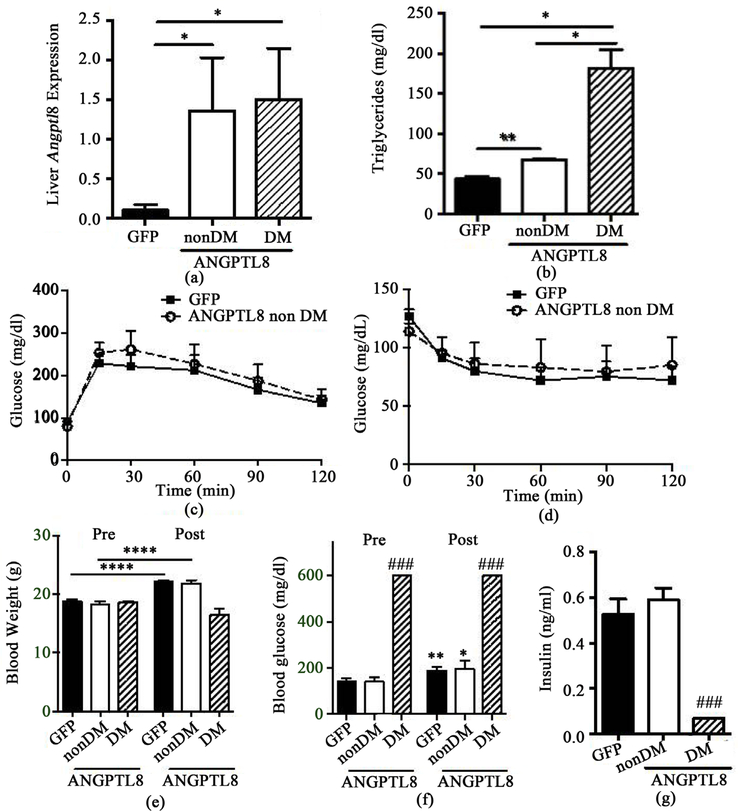
Figure 3.
Glucose homeostasis of NOD mice that received Ad-ANGPTL8 or Ad-GFP. All diabetic (DM) NOD mice (n = 3) at the time of adenovirus administration received Ad-ANGPTL8, while non-diabetic (non-DM) mice were split into those receiving Ad-GFP (n = 10) or Ad-ANGPTL8DM (n = 5). Data are means ± SEM. (a) The expression of ANGPTL8 was determined by qPCR in the liver in Ad-ANGPTL8 (ANGPTL8) or Ad-GFP (GFP) treated NOD mice. Beta actin was used as an internal control; (b) Serum triglycerides at the time of harvest. *: p < 0.05, **: p < 0.01. GTT (c) and ITT (d) comparing non-DM NOD mice that received Ad- ANGPTL8 or Ad-GFP. Body weight (e) and blood glucose (f) prior to adenovirus administration (Pre) and 14 days after adenovirus administration (Post); (g) Serum insulin levels 14 days after adenovirus administration. *: p < 0.05. **: p < 0.01. ****: p < 0.0001 for paired t-test comparing pre and post. ###: p < 0.005 unpaired t-test compared with non-DM ANGPTL8 mice within the same time point.

