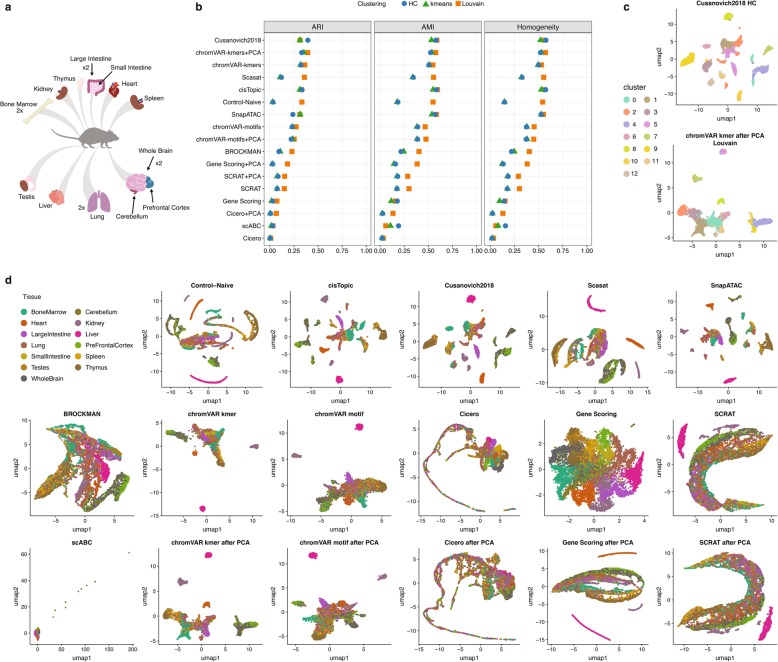
Fig. 6.
Benchmarking results using the downsampled sci-ATAC-seq mouse dataset from 13 adult mouse tissues. a schematic of 13 adult mouse tissues. Replicated tissues are indicated by “x2”. b Dot plot of scores for each metric to quantitatively measure the clustering performance of each method, sorted by maximum ARI score. c The two top-scoring pairings of scATAC-seq analysis method and clustering technique. Cell cluster assignments from each method are shown using the colors in the legend on the left. d UMAP visualization of the feature matrix produced by each method for the downsampled sci-ATAC-seq mouse dataset. Individual cell colors indicate the cell type

