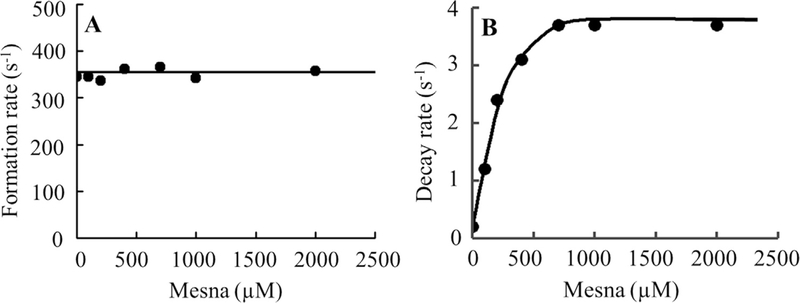
Fig. 7. Rate constants of the formation and decay of MPO Compound I intermediates as a function of mesna concentration.
Panel A, the observed rate constants of Compound I complex formation observed in Fig. 6 were plotted as a function of mesna concentration (R2 value was 0.1296 and slope was 0.0). Data represents the mean of triplicate determinations from an experiment performed three times. Panel B, the rate constants for the decay of compound II complex (slope was 0.01100), for the same reaction monitored at 430 nm as a function of mesna concentration. These data are representative of three independent experiments and the standard error for each individual rate constant has been estimated to be less than 6%.

