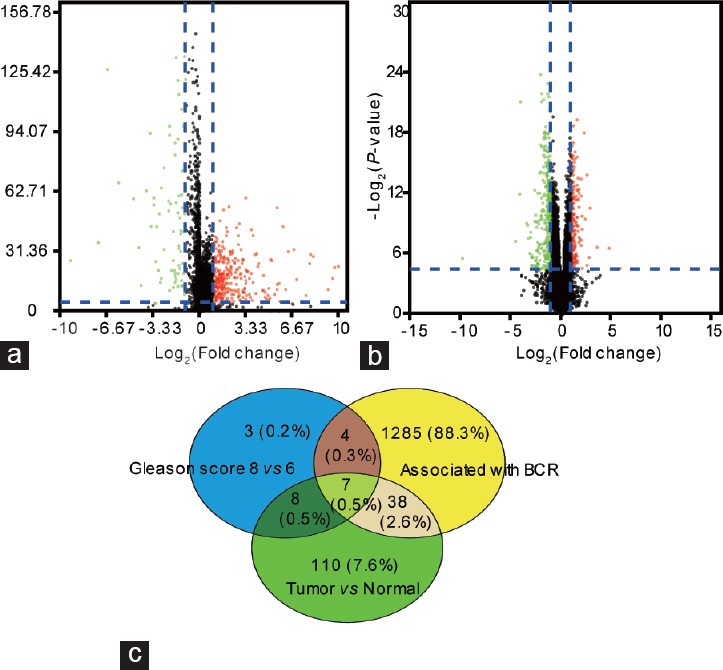
Figure 1.

(a) Volcano plot of differentially expressed lncRNAs between tumor tissues and normal tissues. The red dot represents upregulated lncRNAs and green dot represents down-regulated lncRNAs. (b) Volcano plot of differentially expressed lncRNAs between tissues with Gleason score ≤6 and tissues with Gleason score ≥8. The red dot represents up-regulated lncRNAs and green dot represents downregulated lncRNAs. (c) Seven candidate lncRNAs were identified by Venn diagram. BCR: biochemical recurrence; lncRNAs: long noncoding RNAs.
