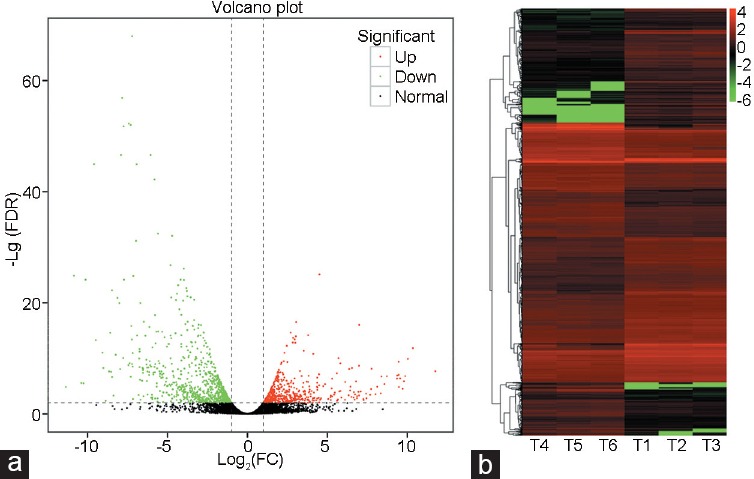
Figure 2.

The (a) volcano plot and (b) heat map of differentially expressed genes. Red dots, green dots, and black dots in a signify the upregulated genes, the downregulated genes, and the nonchanged genes, respectively. (b) The X-axis is the sample number and the Y-axis is the differentially expressed genes. Red color means upregulation and green color means down-regulation. FC: fold change; FDR: false discovery rate.
