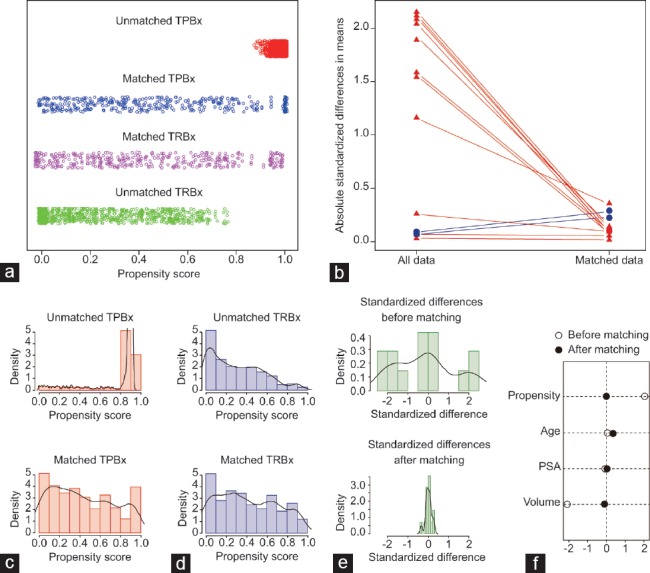
Figure 2.

Balanced diagnostics for comparing the distribution of baseline covariates (age, PSA level and PV) between TRBx group and TPBx group. (a) Jitter plot of distribution of individual patients' propensity scores. (b) Line plot of standardized differences. (c) Histogram of distribution of patients' propensity scores in unmatched and matched TPBx groups. (d) Histogram of distribution of patients' propensity scores in unmatched and matched TRBx groups. (e) Histogram of standardized differences between the two groups before and after matching. (f) Differences of baseline covariates before and after matching. TRBx: transrectal biopsy; TPBx: transperineal biopsy; PSA: prostate-specific antigen; PV: prostate volume.
