Figure 3.

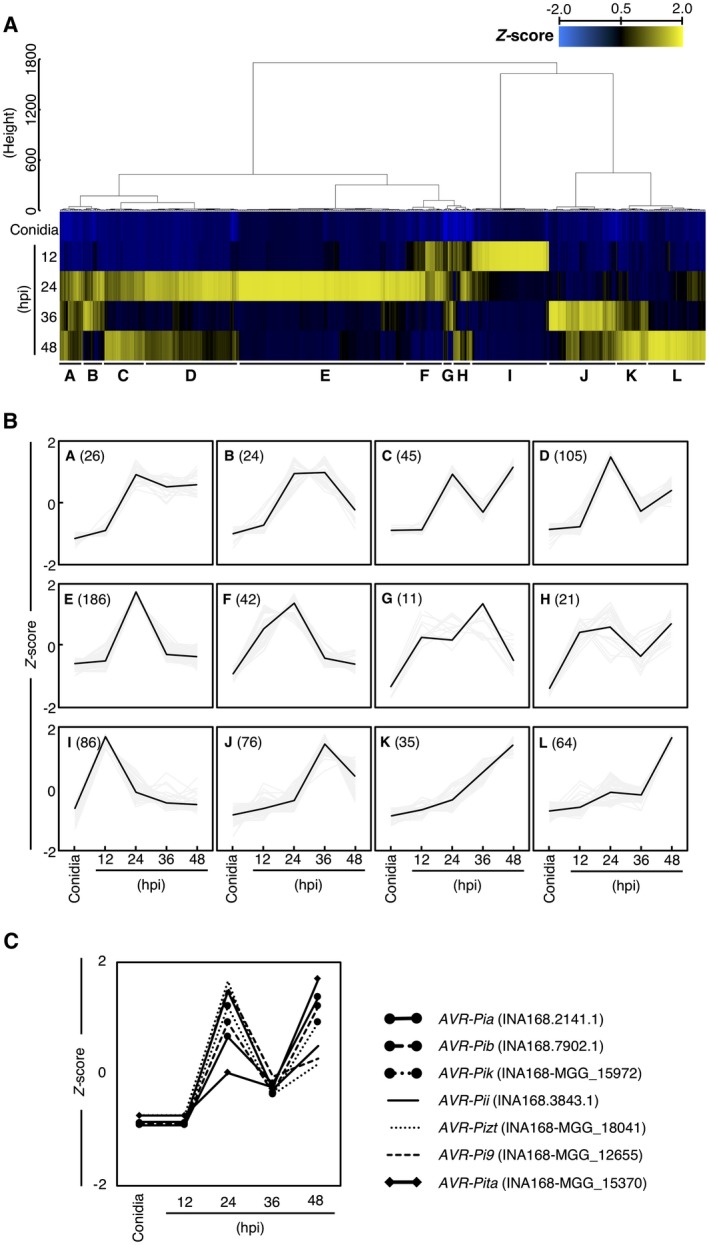
Transcriptome profile of Magnaporthe oryzae isolate Ina168 during barley infection. (A) Heat map showing the expression patterns of 721 DEGs encoding putative secreted proteins with >10‐fold differences in expression between conidia and the early infection stages. (B) Line plots showing the expression patterns of different gene clusters. The number of genes belonging to each cluster is shown in parentheses. (C) Expression patterns of the seven known AVR genes, as analysed by RNA‐Seq.
