
Figure 6.
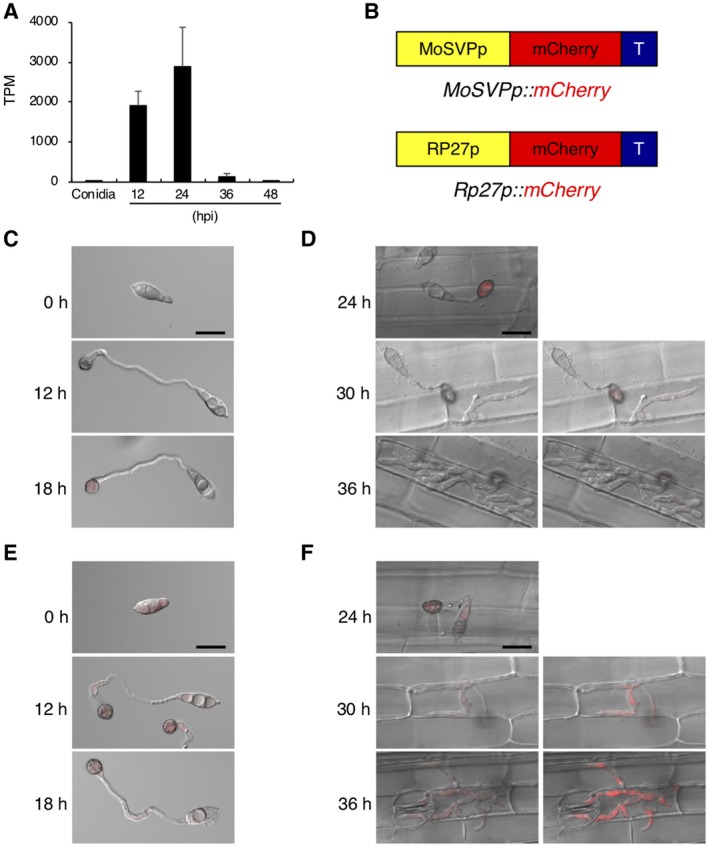
mCherry‐based promoter assay of MoSVP expression. (A) MoSVP expression pattern analysed by RNA‐Seq. (B) Schematic diagram of the mCherry protein expression constructs. (C, E) Conidia of the transgenic lines harbouring MoSVPp::mCherry (C) and Rp27p::mCherry (E) were harvested, and appressorium development and maturation were observed at 0, 12 and 18 hours post‐inoculation (hpi) on glass coverslips. Merged differential interference contrast (DIC) and mCherry (red) images are shown. Scale bar = 20 µm. (D, F) Merged DIC and mCherry images of rice leaf sheath cells infected with transformed conidia harbouring MoSVPp::mCherry (D) and Rp27p::mCherry (F) at 24, 30 and 36 hpi. Right panels show brighter images. Scale bar = 20 µm.