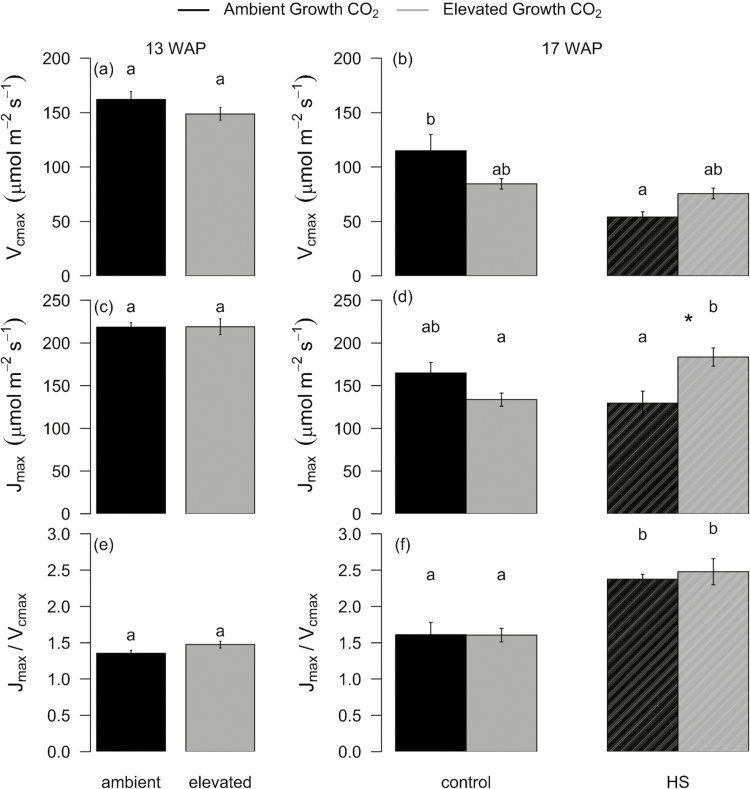
Fig. 3.
Response of Vcmax and Jmax to growth at eCO2 and heat stress (HS) measured 13 and 17 weeks after planting (WAP) at the recovery stage of the HS cycle. Bar plot of means ±SE for Vcmax (a and b), Jmax (c and d), and Vcmax/Jmax (e and f) using two-way ANOVA. Leaf gas exchange was measured at 25 °C in ambient (black) and elevated (grey) CO2-grown plants exposed (HS) or not exposed (Control) to a 5 d HS. Bars sharing the same letter in the individual panels are not significantly different according to Tukey’s HSD test at the 5% level. The error bars indicate the SE of the mean (n=9–10). Statistical significance levels (t-test) for eCO2 effect are shown: *P<0.05; **P<0.01: ***P<0.001.

