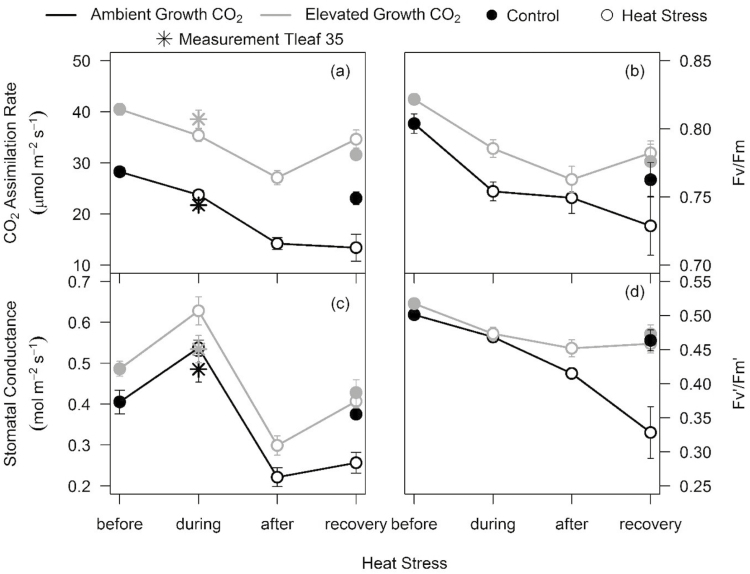
Fig. 4.
Photosynthesis and chlorophyll fluorescence response of aCO2- and eCO2-grown wheat cv. Scout measured before, during, after, and at the recovery stage of the heat stress cycle. CO2 assimilation rates (a), of the Fv/Fm ratio in dark-adapted leaves (b), stomatal conductance (c), and of the Fv'/Fm' ratio in light-adapted leaves (d) measured at growth CO2 (aCO2-grown plants measured at 400 μl l−1 and eCO2-grown plants measured at 650 μl l−1). Values are means ±SE (n=9–10). Ambient and elevated CO2-grown plants are depicted in black and grey, respectively. Filled and open circles represent control and heat-stressed plants, respectively. The circle and star symbols depict CO2 assimilation rates measured at 25 °C and 35 °C, respectively.

