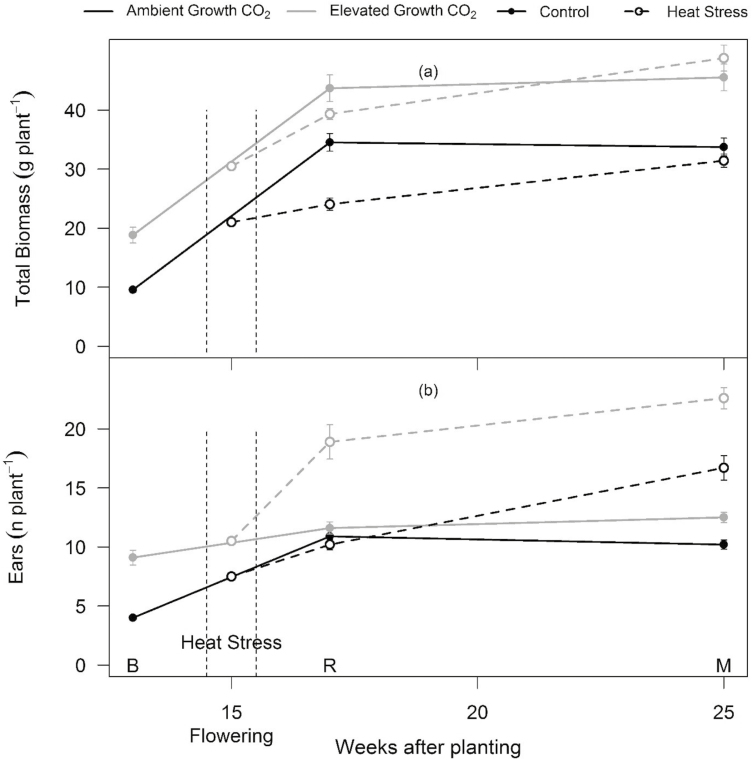
Fig. 5.
Response of biomass and ears (or tillers) to eCO2 and HS across the life cycle of wheat cv. Scout. Response of total biomass (a) and spike number (b) to eCO2 and HS at three time points; before HS (B), after recovery from HS (R), and at the final harvest after maturity (M). Ambient and elevated CO2-grown plants are depicted in black and grey, respectively. Solid and dotted lines represent control and heat-stressed plants, respectively. Filled and open circles represent control and heat-stressed plants, respectively. Vertical black dotted lines show the timing of HS. Symbols are means per plant ±SE (n=9–10).

