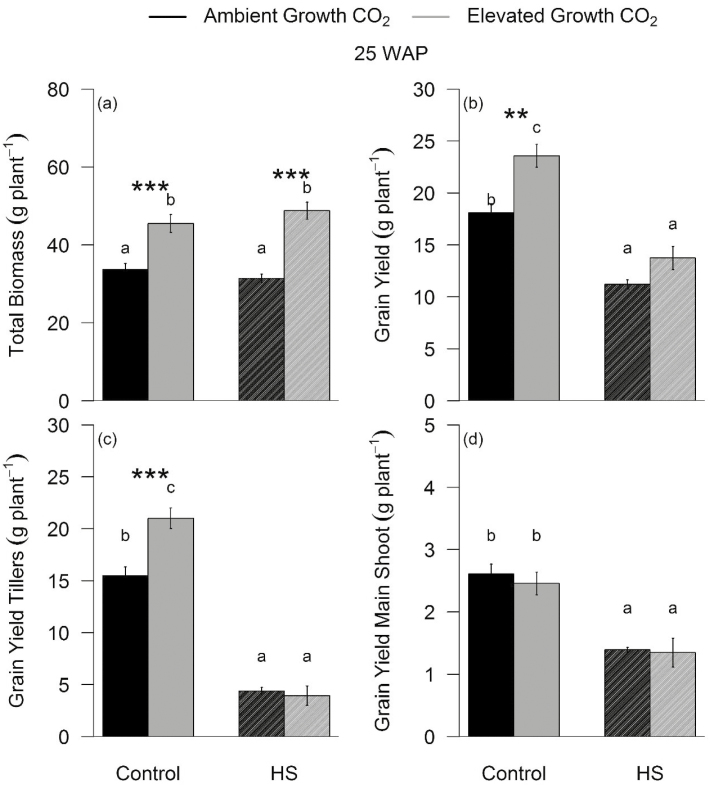
Fig. 6.
Response of plant total biomass and grain yield to elevated CO2 and heat stress (HS) at the final harvest. Bar plot of means ±SE for total biomass (a), grain yield (b), grain yield of tillers (c), and grain yield of the main shoot (d) using two-way ANOVA measured in ambient (black) and elevated (grey) CO2-grown plants exposed (HS) or not exposed (Control) to a 5 d HS. Bars sharing the same letter in the individual panels are not significantly different according to Tukey’s HSD test at the 5% level. Values are means ±SE (n=9–10). Statistical significance levels (t-test) for eCO2 effect are shown: *P<0.05; **P<0.01: ***P<0.001.

