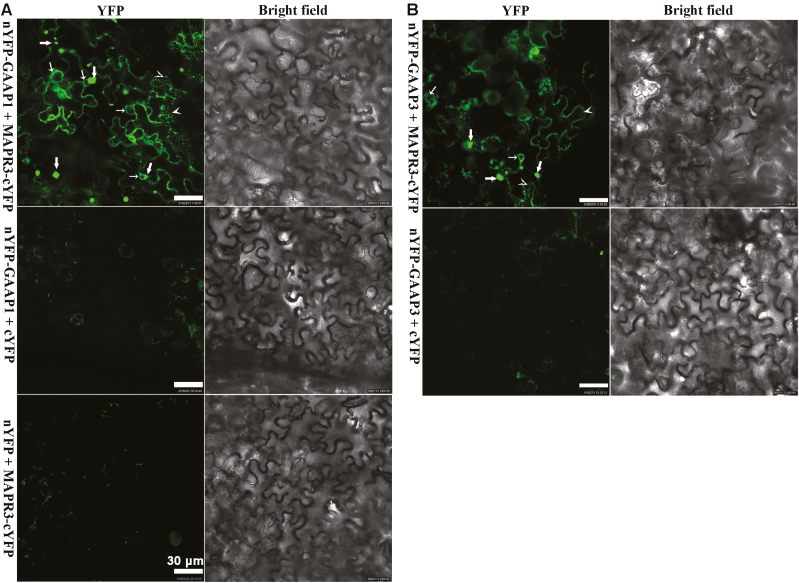
Fig. 2.
GAAP1 and GAAP3 interacted with MAPR3 shown by BiFC assay. (A and B) YFP fluorescence was observed when nYFP–GAAP1/GAAP3 and MAPR3–cYFP were co-expressed in tobacco leaf cells, whilst only the background signal of chlorophyll was observed when nYFP–GAAP1/GAAP3 and cYFP or MAPR3–cYFP and nYFP were co-expressed. Thick arrows indicate punctate or granule signals, thin arrows point to rings, and arrowheads point to the mesh signals.

