Fig. 7.
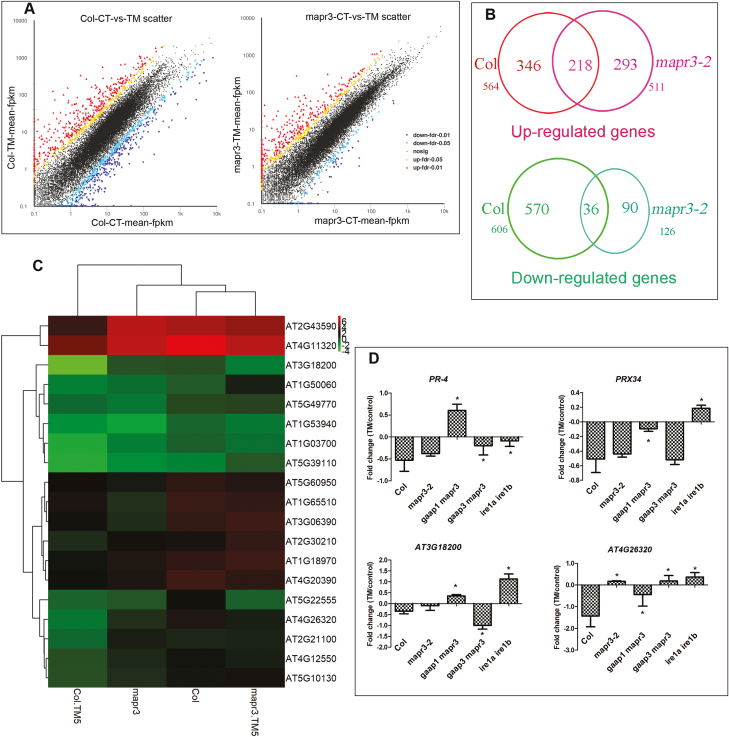
RNA sequencing of Col and mapr3 showed the effects of MAPR3 on ER stress resistance. (A) Plot of reads assigned fragments per kilobase of exon per million reads mapped (FPKM) values for Col and mapr3 in the control versus seedlings after 6 h of 5 μg ml−1 TM treatment. Significantly up- or down-regulated genes are indicated by red or blue circles, respectively, whilst other data points are plotted in black. (B) Overlap of up- or down-regulated genes in Col and mapr3-2 upon TM treatment; the number of differentially expressed genes in each section is indicated. (C) Heatmap showing levels of transcript abundance of RIDD genes in Col and the mapr3 mutant under control conditions and 5 μg ml−1 TM treatment for 5 h. Gene expression values were log2 transformed. Down-regulated genes with log2 fold change (FC) of <−0.8) in Col and the difference in FC between Col and the mapr3 mutant upon TM treatment >1.5 were selected here. (D) qRT–PCR analysis of RIDD genes in 7-day-old mapr3-2, gaap1mapr3 gaap3mapr3, and ire1a ire1b plants pre-treated with 75 μM ActD for 2 h followed by 1 μg ml−1 TM treatment or mock treatment for 5 h. The relative gene expression was the expression level of each gene in plants of different genotype normalized to the level in the wild-type control, both of which were normalized to the expression of ACTIN8. The FC of treatment and control of each gene was transformed as log2 FC. Error bars represent ±SE of two independent biological experiments with three technical replicates. *Statistical differences between the mutant and Col (Student's t-test, *P<0.05).

