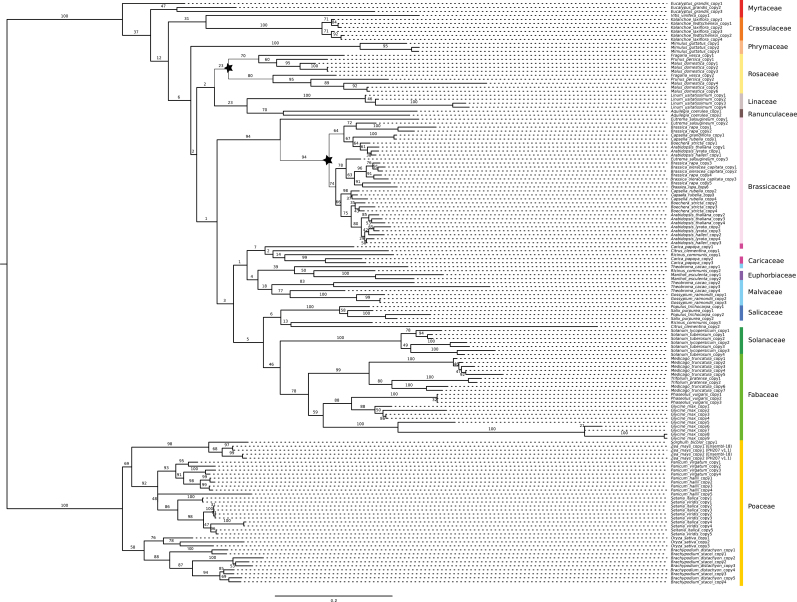
Fig. 1.
Maximum likelihood tree of rbcS lineage 1 in angiosperms. The phylogenetic tree was reconstructed in PhyML v3.0 (Guindon and Gascuel, 2003) using a TN93 model. Each gene copy of a given species is identified by the species name and distinguished by a number (see Supplementary Table S1 for correspondence of gene copy name used in this figure and gene ID in Phytozome database). Names of plant families are indicated on the right next to the species names except for Citrus clementina and Ricinus communis. Because the gene copies of these two species were spread all over the tree and did not cluster within a family, their family names are not indicated in this tree. Branch support was estimated using 1000 bootstraps replicates. Values above or below the branches represent the bootstrap support for each branch (%). The scale bar is shown below the phylogeny. Stars indicate the duplication events within a family.

