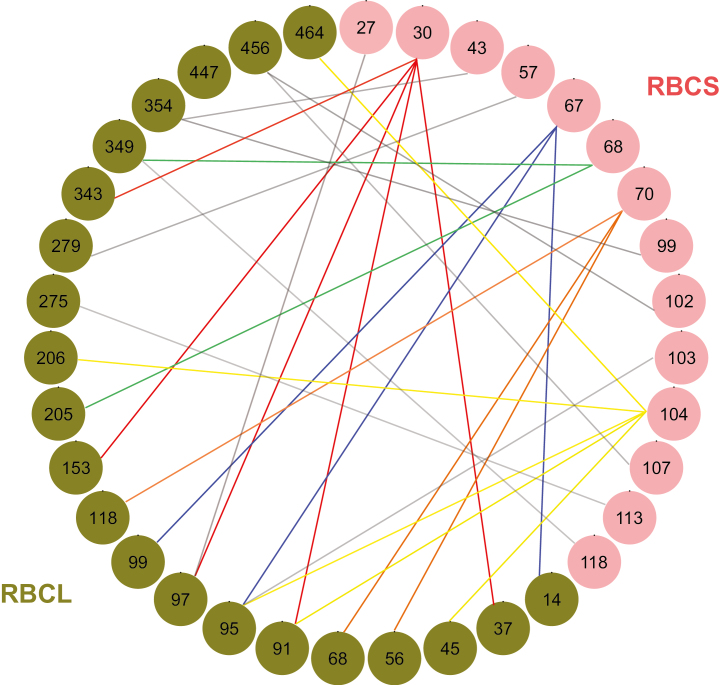
Fig. 4.
Coevolving residues between RBCS and RBCL. Coevolution between paired combinations of rbcS sites and rbcL sites was estimated by a maximum-likelihood implementation of Coev and dependent model using nucleotide sequences. The differences in AIC between pairs of models (dAIC) were calculated. AIC of the null model (9.893) was used as a threshold. We then filtered further with the s/d ratio threshold (0.1) according to previous studies (Dib et al., 2014, 2015). The 28 coevolving profiles with the strongest signals (dAIC >35 and s/d ratio <0.1) were selected (see Table 2). We identified the corresponding amino acid residues and plotted these sites using the qgraph function of R (Epskamp et al., 2012). The residues of RBCS and RBCL are shown by pink and green filled circles, respectively and the numbers in the circles indicate the residues of known RuBIsCO structure (1RCX of Protein Data Bank; Taylor and Andersson, 1997). A coevolving profile pair is connected with a line. The coevolution profiles including the same RBCS residues are shown as lines of the same colour connected with multiple RBCL residues (e.g. lines in red, blue, yellow, orange, and green). Grey lines show the other coevolving profiles including the residues of RBCS that coevolve with a single RBCL among listed 28 profiles.

