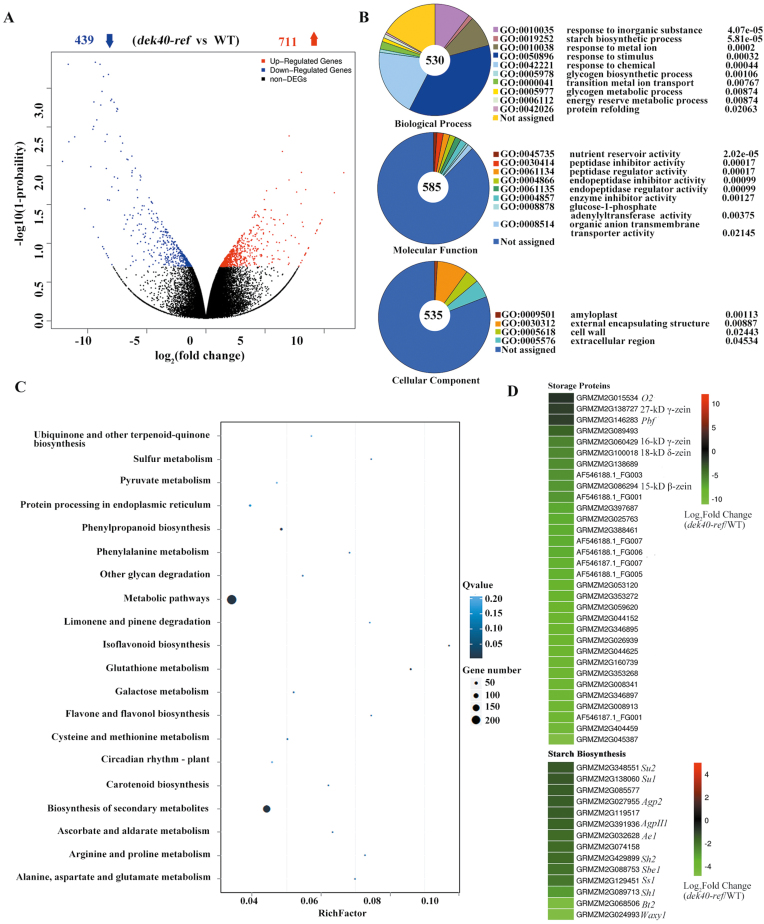
Fig. 10.
Identification of differentially expressed genes (DEGs) between the WT and dek40-ref by RNA-seq. (A) The number of DEGs between the dek40-ref mutant and WT. Fold change ≥2; –log10(1–probability) ≥0.8. Blue and red arrows represent the number of down- and up-regulated genes in dek40-ref compared with the WT, respectively. (B) The most significantly related GO terms of the functional annotated DEGs, P<0.05. (C) Pathway functional enrichment of DEGs. The x-axis represents the enrichment factor and the y-axis represents the pathway name. (D) Heat maps of differentially expressed genes involved in storage protein and starch biosynthesis.

