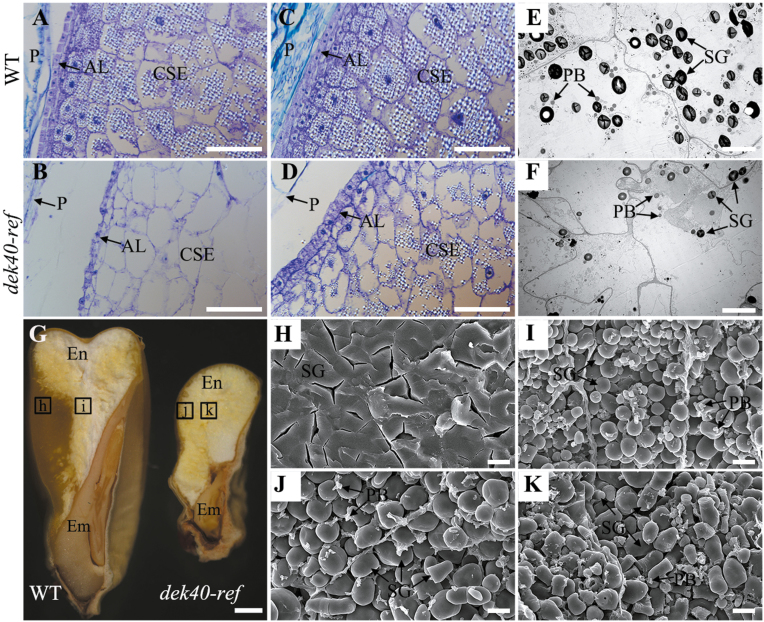
Fig. 2.
Comparisons of endosperm in the WT and dek40-ref at different developmental stages. (A and B) Histological section analysis of 13 DAP endosperm of WT (A) and dek40-ref (B) kernels. Scale bars=100 μm. (C and D) Histological section analysis of 15 DAP endosperm of the WT (C) and dek40-ref (D) kernels. Scale bars=100 μm. (E and F) TEM images of 13 DAP endosperms of the WT and dek40-ref kernels. Scale bars=10 μm. (G) Longitudinal dissection of WT and dek40-ref mature kernels. Scale bars=1 mm. (H–K) SEM images of WT and dek40-ref mature endosperm in (G). (H and I) SEM images of WT endosperm in the areas h and i indicated in (G). Scale bars=10 μm. (J and K) SEM images of dek40-ref endosperm of in the areas j and k indicated in (G). Scale bars=10 μm. En, endosperm; Em, embryo; P, pericarp; AL, aleurone layer; CSE, central starch endosperm; PB, protein body; SG, starch grain.

