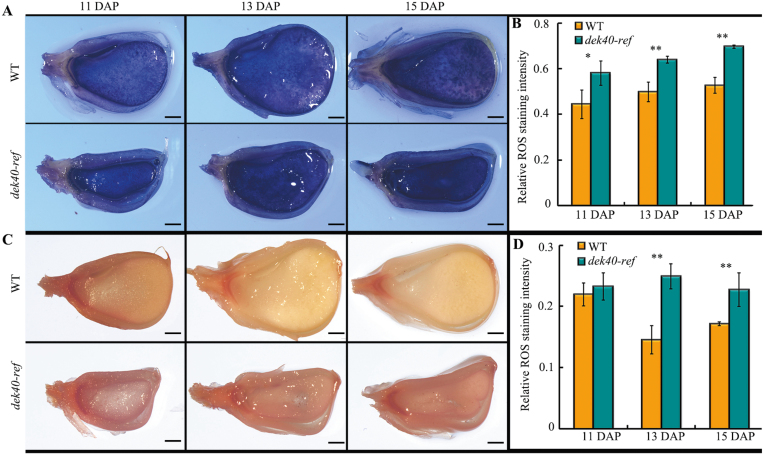
Fig. 8.
Abnormal accumulation of ROS in dek40-ref endosperm. (A) NBT staining for the detection of superoxide (O2−) in endosperm of the WT and dek40-ref at 11, 13, and 15 DAP. Scale bars=1 mm. (B) Relative NBT staining intensity in endosperm of the WT and dek40-ref at the indicated developmental stage. (C) DAB staining for the detection of hydrogen peroxide (H2O2) in endosperm of the WT and dek40-ref at 11, 13, and 15 DAP. Scale bars=1 mm. (D) Relative DAB staining intensity in endosperm of the WT and dek40-ref at the indicated developmental stages. Values and bars represent the mean and the SD of more than five biological replicates, respectively. Significant differences are indicated. *P<0.05, **P<0.01 (Student’s t-test).

