Fig. 2.
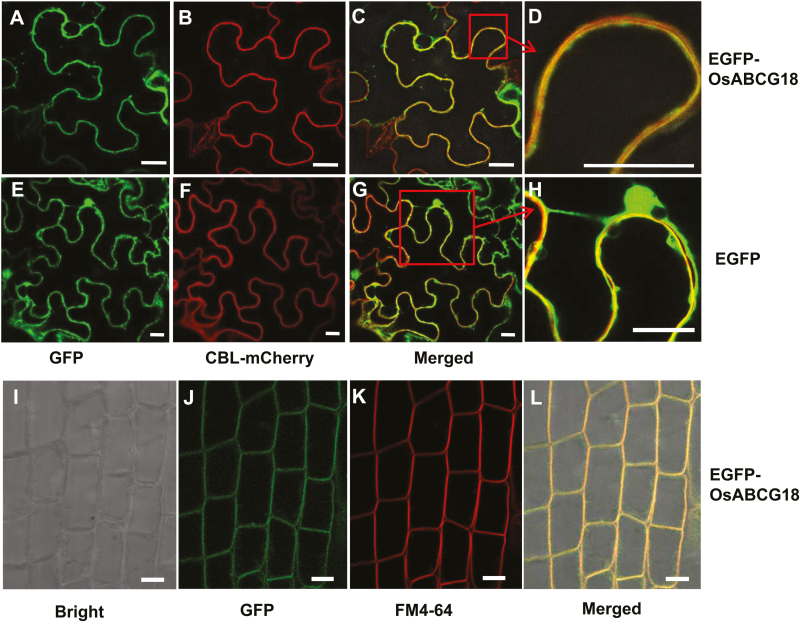
Subcellular localization of the GFP–OsABCG18 fusion protein. Green fluorescence distribution when 35S::EGFP-OsABCG18 (A) or 35S::EGFP (E) was transiently expressed in tobacco leaf epidermal cells; red fluorescence distribution of the plasma membrane marker CBL–mCherry (B) and (F) and their merged images with (A) and (E) as (C) and (G). (D) An enlarged image of (C), which indicates that EGFP–OsABCG18 was completely merged with the plasma membrane marker CBL–mCherry, but the negative control EGFP was only partially merged with CBL–mCherry (G and H). Scale bar=20 µm. (I–L) The fluorescence distribution in the root tip region of OsABCG18pro::EGFP-OsABCG18 transgenic rice; the DIC image of the root (I), green florescence of EGFP–OsABCG18 (J), and red florescence of FM4-64 (K) are merged in (L). Scale bars=20 µm. The roots were stained with 10 mM FM4-64 (Molecular Probes) for 10–30 min.

