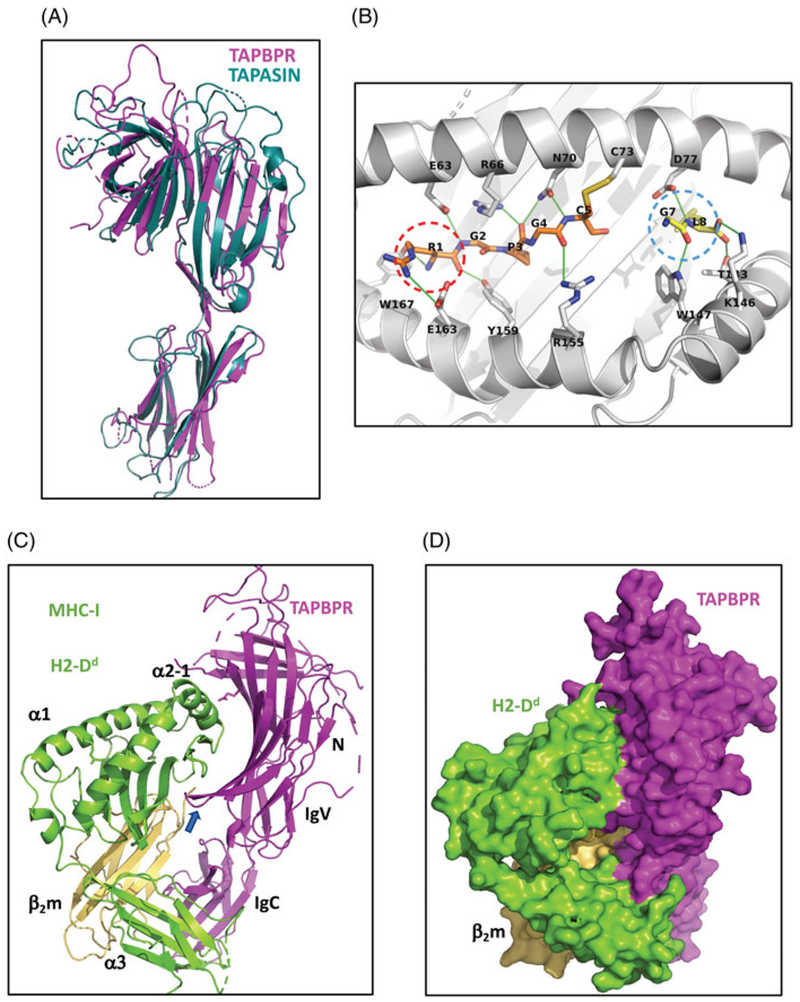
Figure 2.
X-ray structures of H2-Dd/5-mer and TAPBPR/H2-Dd complexes. (A) Ribbon diagram of superposition of TAPBPR (magenta) (PDB ID: 5WER) with tapasin (blue-green) (PDB ID:3F8U). (B) The covalently bound 5-mer (RGPGC) in complex with H2-DdT73C/β2m with GL dipeptide visualized in the F pocket (PDB ID: 5WES). The locations of pocket A and F are indicated by dashed red and light blue circles, respectively. (C) Ribbon diagram of TAPBPR/H2-Dd/β2m complex (PDB ID: 5WER). Arrow indicates loop that senses peptide occupancy. (D) Surface representation of TAPBPR/H2-Dd/β2m. For (A) TAPBPR is magenta, tapasin is blue-green; (B) peptide is orange, GL dipeptide is yellow, H2-Dd is gray; (C,D), TAPBPR is magenta, H2-Dd is green, and β2m is yellow (see colour version of this figure at www.tandfonline.com/ibmg).

