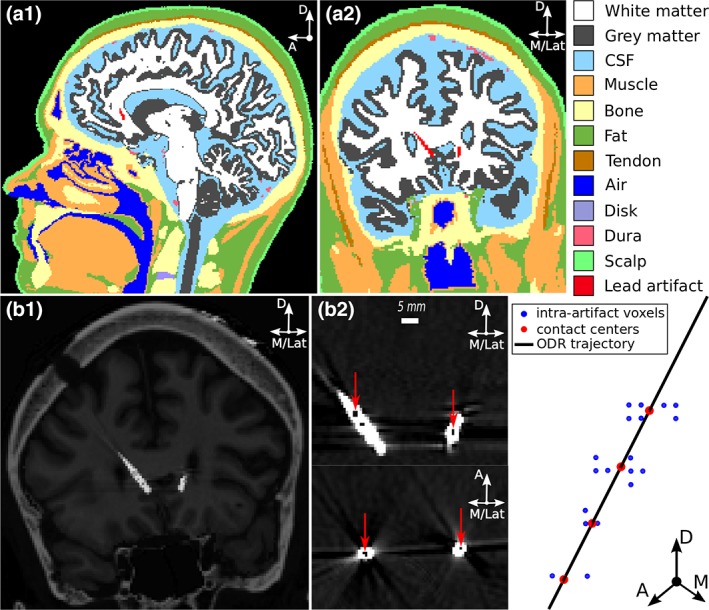
Figure 1.

Image‐based volume conductor model of Patient 2. (a1) Sagittal and (a2) coronal views of patient's head segmented into 12 different regions. Knowledge of the locations and electrical properties of the different head regions was used to construct a volume conductor model of the patient's head. (b1) Artifacts produced by the Medtronic 3387 leads in the postoperative computed tomography image were identified using regions of minimal intensity within the artifacts and (b2) orthogonal distance regression was used to fit a straight trajectory to the intra‐artifact regions (red arrows). The 3387 leads were modeled as surfaces within the volume conductor model. D = dorsal; A = anterior; M = medial; Lat = lateral
