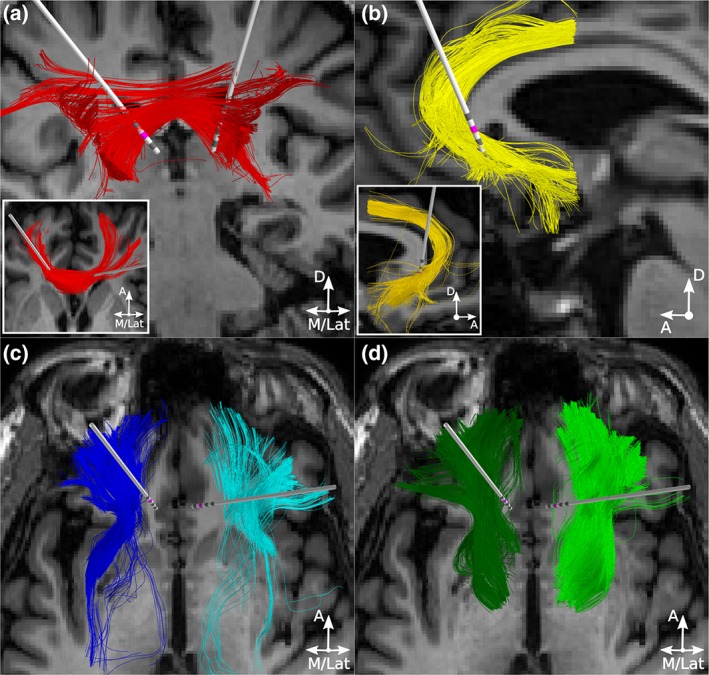
Figure 2.

Candidate therapeutic pathways in Patient 2. Probabilistic tractography was used to define (a) one interhemispheric pathway, forceps minor (red streamlines) and three intrahemispheric pathways per hemisphere: (b) cingulum bundle (yellow streamlines), (c) uncinate fasciculus (blue streamlines), and (d) subcortical projections from the frontal pole to the thalamus and ventral striatum (green streamlines). Active contacts are in pink. D = dorsal; A = anterior; M = medial; Lat = lateral [Color figure can be viewed at http://wileyonlinelibrary.com]
