FIGURE 2.
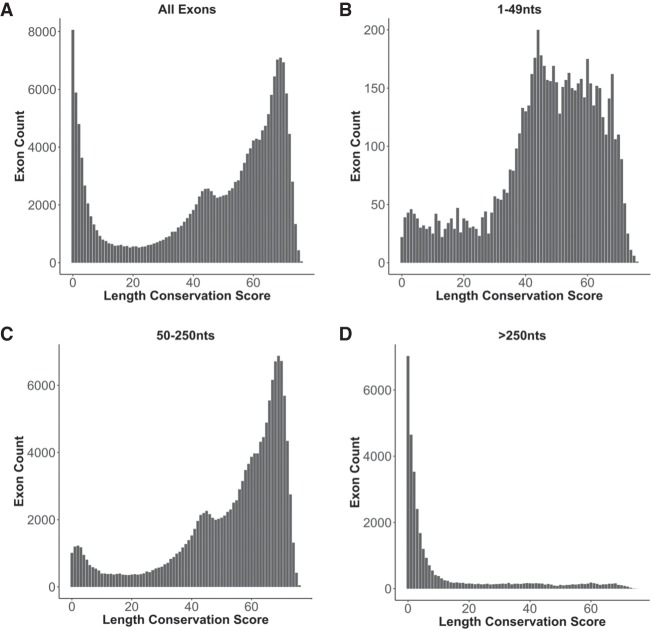
Distribution of exons across 76 length-conserved species. The length conservation score is defined as the number of species with length-conserved exons when compared to human. The number of exons in each length conservation bin is plotted for (A) all types of exons, (B) all exons between 1 and 49 nt in length, (C) exons between 50 and 250 nt in length, and (D) exons longer than 250 nt in length.

