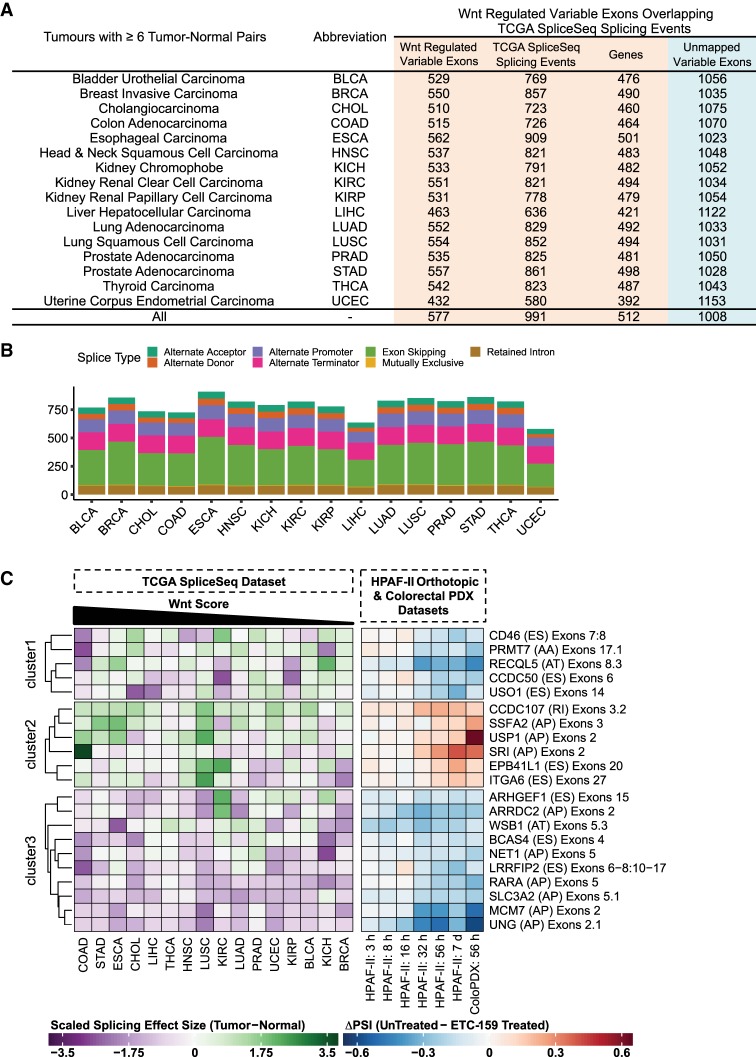
FIGURE 4.
Wnt regulated isoform expression changes are found in multiple cancer types. (A) Tabulation of the number of Wnt regulated variable exons that overlap with splicing events described in the TCGA SpliceSeq database for each tumor type. Only tumors with at least six tumor-normal pairs were considered for the analysis. The unmapped Wnt regulated variable exons did not overlap with any significant splicing events in the TCGA SpliceSeq database for the tumors tested. (B) Frequency plot of the different types of splicing events (n = 991) in the TCGA SpliceSeq database that overlapped with Wnt regulated variable exons. Plot shows the distribution of the splicing events for each tumor type. (C) Heatmap of a subset of the splicing events (described in the TCGA SpliceSeq database) that overlap with Wnt regulated variable exons. We define these as Wnt regulated splicing events. Each row is annotated with gene name, (splice type), and affected exons. The left panel shows the effect size (Hedges’ g-estimate) of the splicing change (ΔPSI) seen in the 16 cancer types relative to the matched normals. The effect sizes were scaled by row (divided by the root mean square) but not centered. The tumor types were sorted according to the Wnt score (Materials and Methods). The higher the Wnt score, the greater the relative influence of Wnt/β-catenin signaling on the tumor. The right panel shows the magnitude of splicing change (ΔPSI) for different time points in the HPAF-II orthotopic and the colorectal PDX (ColoPDX) models. Both panels refer to the same set of splicing events. The different splice types include (AA) alternative acceptor, (AD) alternative donor, (AP) alternative promoter, (AT) alternative terminator, (ES) exon skipping , (RI) retained intron. The heatmap was clustered into three sets via k-means clustering followed by hierarchical clustering to sort the genes within the sets.

