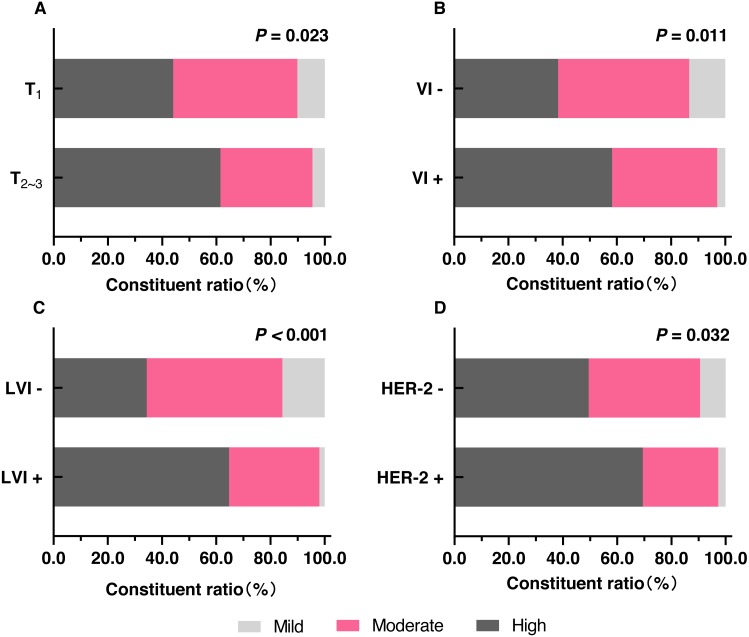
Figure 2. The distribution of different degrees of fibrosis in FF in different clinicopathologic features.
(A) The comparison of the proportions of different degrees of fibrosis in FF between T ≤ two cm (T1) and T > two cm (T23). (B) The comparison of the proportions of different degrees of fibrosis in FF between VI- and VI+. (C) The comparison of the proportions of different degrees of fibrosis in FF between LVI- and LVI+. (D) The comparison of the proportions of different degrees of fibrosis in FF between HER-2- and HER-2+. Notes: T, tumor size; VI-, no vascular invasion; VI+, vascular invasion; LVI-, no lymphatic vessel invasion; LVI+, lymphatic vessel invasion.

