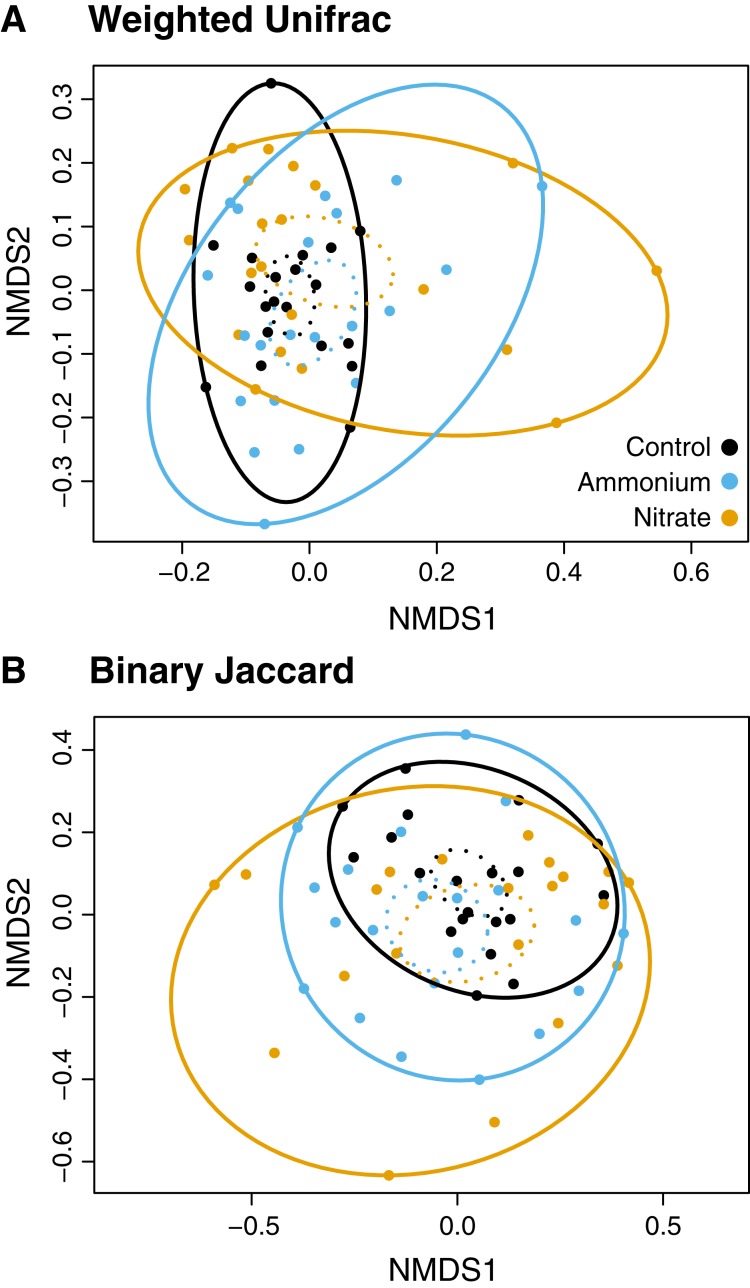
Figure 4. NMDS plots of the microbial community associated with nutrient treatment.
Both dissimilarity measures, (A) Weighted Unifrac (F = 4.1, P < 0.05) and (B) Binary Jaccard (F = 4.2, P < 0.05), show increased community dispersion by nutrient treatment for the log-transformed OTU table (Table S7). Dashed ellipses designate standard errors of points with 95% confidence limit. Solid ellipses enclose all points within a group.

