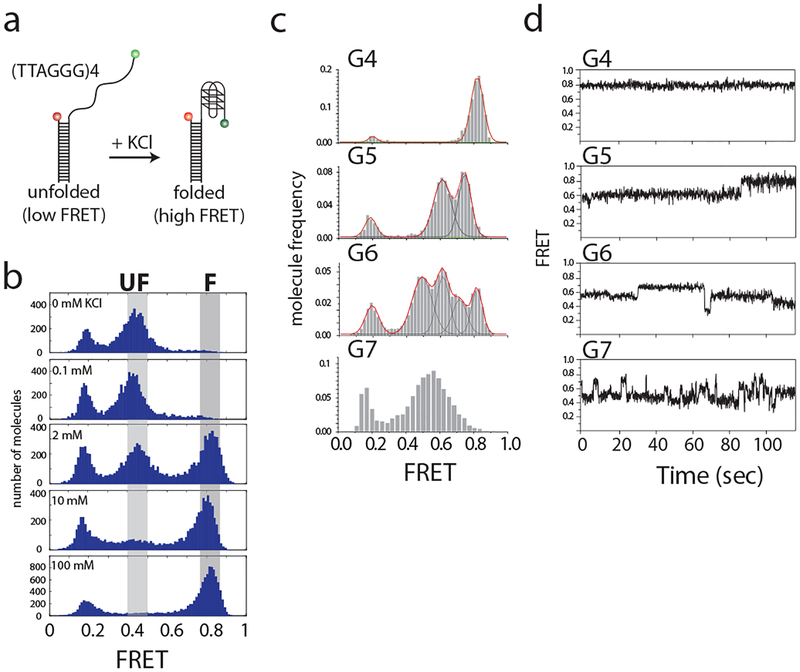
Fig. 2.
FRET histograms show G-quadruplex folding. (a) Scheme of single molecule FRET constructs. Formation of G-quadruplex can be induced by addition of potassium ions. (b) FRET histograms showing G-quadruplex folding after titration of K+. Increasing K+ concentration enhances the folded population. Three major peaks observed here are at FRET efficiencies of 0.8, 0.5 and 0.2, representing folded, unfolded and donor-only constructs. (c) FRET histograms of constructs with increasing 3’ overhang lengths. Red line indicates overall shape of fitting; black line indicates the Gaussian distribution fit to each peak. (d) Time trace examples of each overhang construct. This figure was reproduced from published work (Helen Hwang, 2014) with permission from Elsevier. (14)

