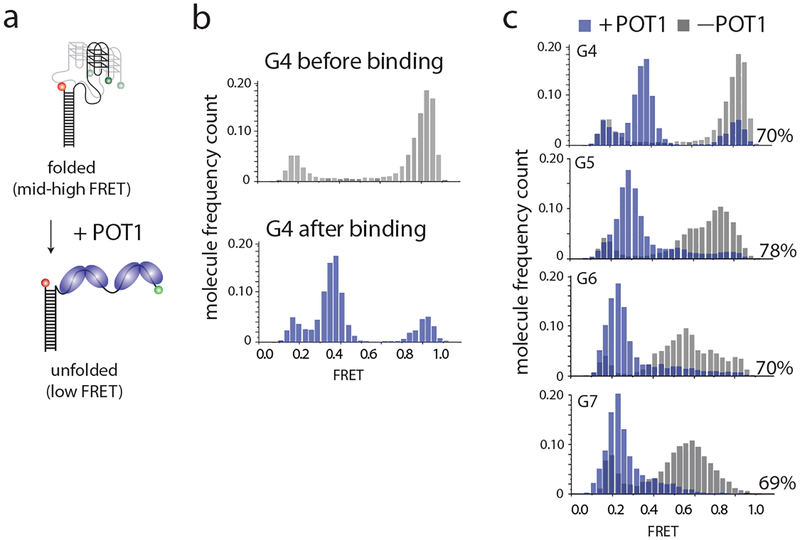
Fig. 3.
FRET histograms show POT1 binding. (a) Scheme of POT1 binding on DNA. POT1 binding unfolds the G4 structure and reduces FRET efficiency. (b, c) FRET patterns change after POT1 binding. Grey depicts FRET efficiency distributions prior to POT1 binding, and blue shows the distributions after POT1 binding. The binding ratio, calculated from the area beneath each curve, is displayed to the bottom right of each histogram. This figure was reproduced from published work (Helen Hwang, 2014) with permission from Elsevier. (14)

