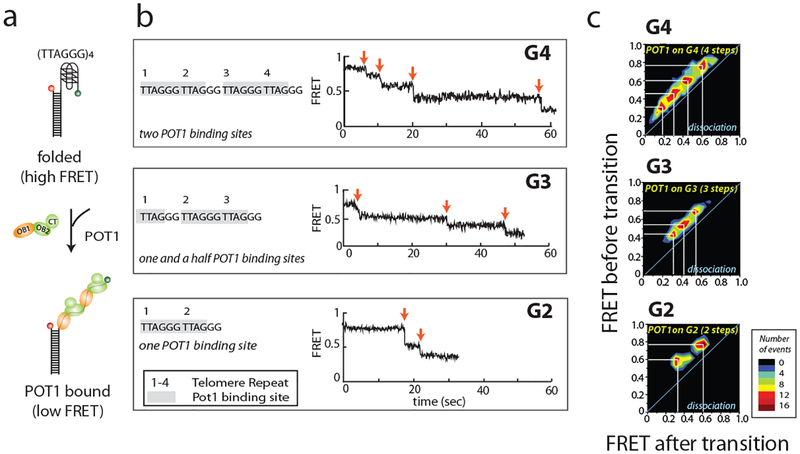
Fig. 4.
Dissecting POT1 binding site from smFRET time trace. (a) Scheme of POT1 binding. POT1 consists of three domains, OB1, OB2 and CT. Both OB1 and OB2 bind to telomere sequence TTAGGGTTAG. (b) Representative smFRET time trace of each construct. Time zero is the time the protein was flowed into the channel. Each red arrow indicates a FRET transition, which is correlated to the number of binding sites. (c) Transition density plots (TDP) of each construct. The x axis and y axis are the FRET state after and before transition. This figure was reproduced from published work (Helen Hwang, 2012) with permission from Elsevier. (15)

