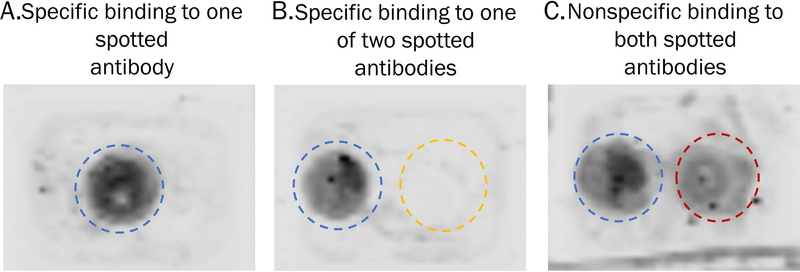
Figure 5.
Visualization of IR-labelled proteins captured to antibody spots. A) A single antibody was spotted and signal is localized to a circle, indicating capture of IR-labelled protein to its antibody spot. B) Two antibodies were spotted side-by side and signal is only present in one circle, indicating specific capture of the IR-labelled protein by its antibody. C) Two antibodies were spotted side-by-side and protein signal is observed on both spots, indicating non-specific capture of IR-labelled protein.

