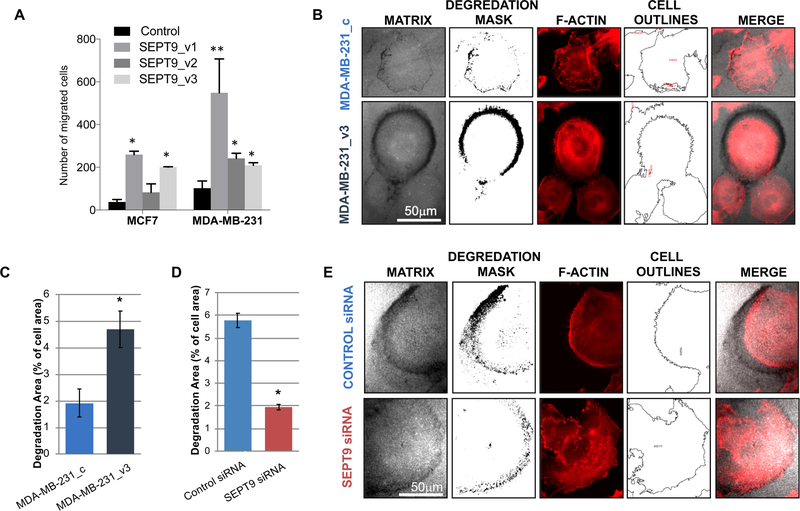
Figure 2: SEPT9 promotes fluorescent matrix degradation by MDA-MB-231 cells.
A. Transwell migration assay comparing MCF7 and MDA-MB-231 clones, each expressing a different GFP-SEPT9 isoform fusion construct. Cells were added to transwell inserts and allowed to migrate for 10 hours at 37°C, after which migrated cells were counted. Plotting reflects the average number of migrated cells from two biological replicate assays conducted for each isoform. Statistical differences were calculated using ANOVA, *p<0.05 **p<0.02. B. Degradation patterns of MDA-MB-231_c (control) and MDA-MB-231_SEPT9_v3 cells. Images of matrix channel are shown together with the degradation mask and the F-actin staining (red) together with the outlines of cell areas. Bar = 50μm. C. Bar plot depicting the percentage of gelatin degradation area (representative 4×5 panel use for analysis is shown in Supplementary Figure 4A). Bars represent the mean of the degradation area as % of total cell area and error bars represent the standard error of the mean (SEM). *, p < 0.033. Data was confirmed at least by three independent experiments. D-E. Degradation patterns of MDA-MB-231 transfected with SEPT9 siRNA or scramble (control) siRNA. Images of matrix channel are shown with the degradation mask and the F-actin staining (red) together with the outlines of cell areas (E). Bar = 50μm Bar plot depicting the percentage of gelatin degradation area (representative 4×5 panel use for analysis is shown in Supplementary Figure 4A). Bars represent the mean of the degradation area as % of total cell area and error bars represent the standard error of the mean (SEM).
*, p < 0.001. Data was confirmed at least by three independent experiments.

