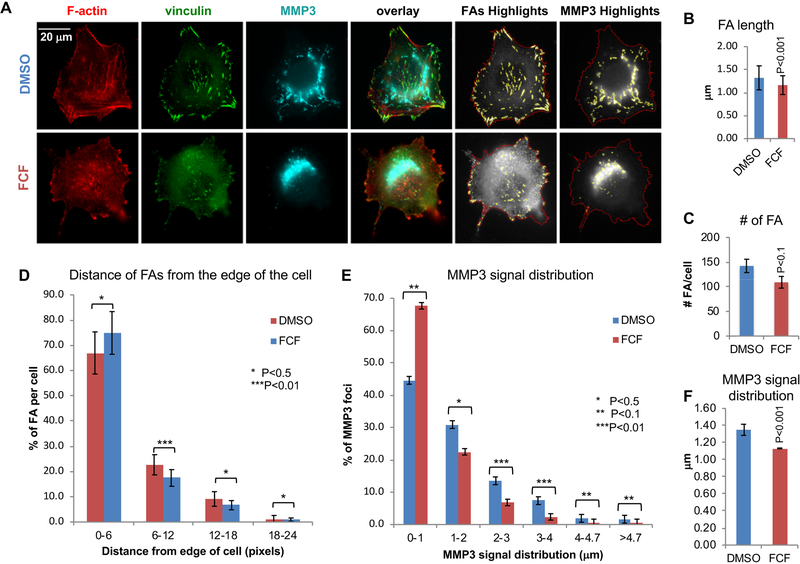
Figure 7: Inhibition of Septins by FCF results in impairment of FAs and MMP3 trafficking.
A. Representative images of MDA-MB-231 control cells (DMSO) or FCF treated; F-actin (red), vinculin (green), and MMP3 (cyan). Also shown are FA highlights (FAs in yellow and cell outlines in red) and MMP3 highlights (MMP3 in yellow and cell outlines in red). Bar = 20μm. B–C. Bar graphs indicating the quantification of FAs in MDA-MB-231 cells (n= 15 cells) treated with DMSO (n= 2523 FAs) and FCF (n=1307 FAs). See corresponding FA highlights in supplementary Figure 9. B. Bar graph indicating FA average length (μm). C. Bar graph indicating the number of FAs per cell. D. Histogram indicating the distribution of the FAs according to their distance from the edge of the cell (μm). E-F. Bar graphs indicating the quantification of MMP3 signals in MDA-MB-231 cells (n= 15 cells) treated with DMSO (n=1510 MMP3 signals) and FCF (n=853 MMP3 signals). See corresponding MMP3 highlights in supplementary Figure 10. E. Histogram indicating the distribution of MMP3 signals according to their length (μm). F. Bar graph indicating the MMP3 signal average length (μm). Error bars indicate SEM.
*, P<0.5; **, P < 0.1; ***, P < 0.01.

