. 2019 Nov 14;6(6):064701. doi: 10.1063/1.5122849

TABLE IV.

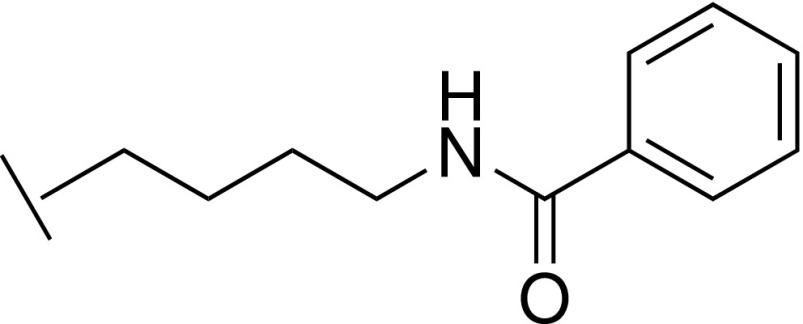
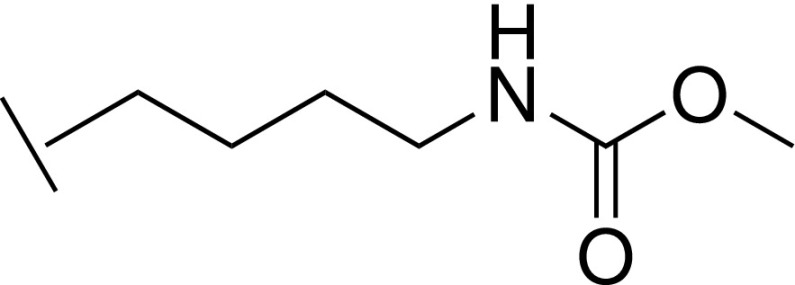
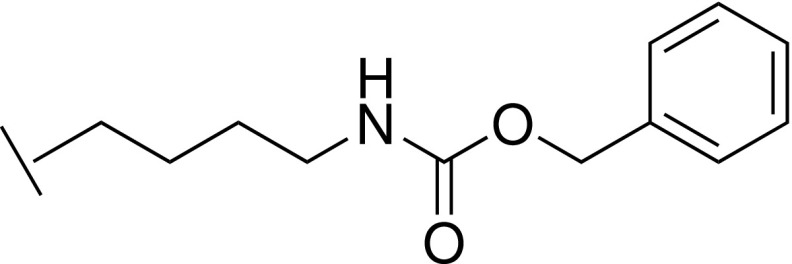
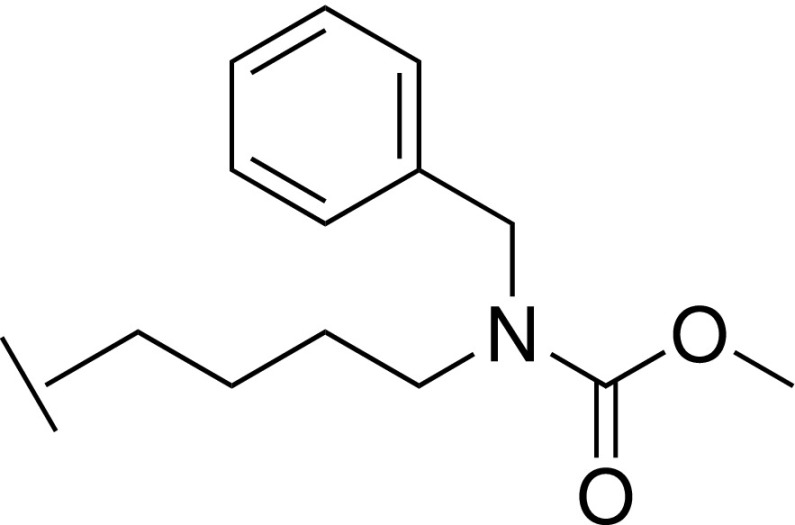
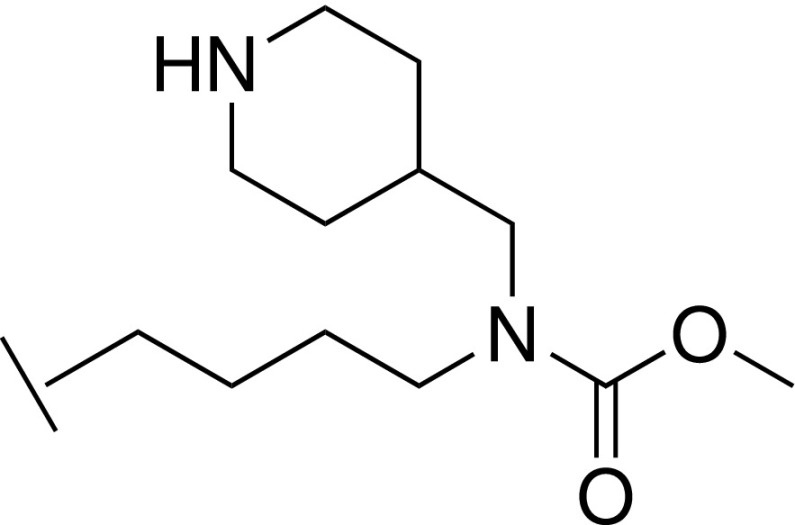
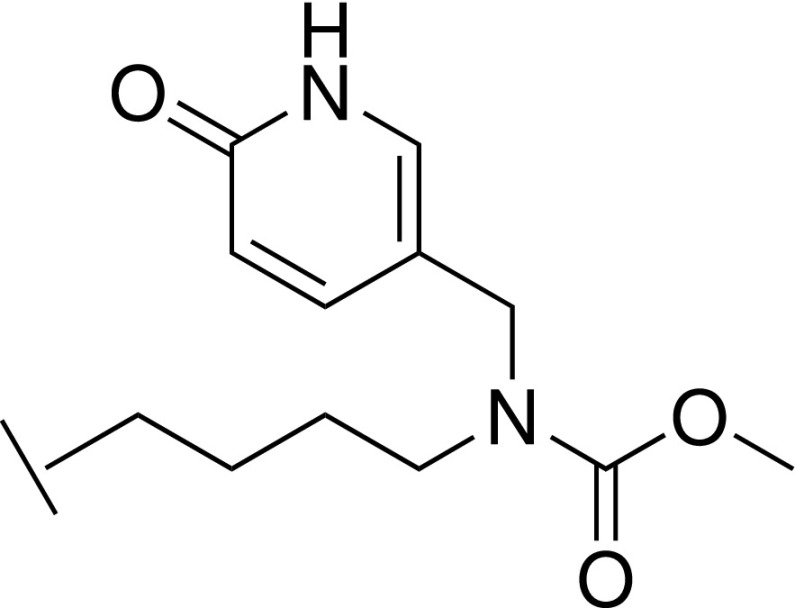
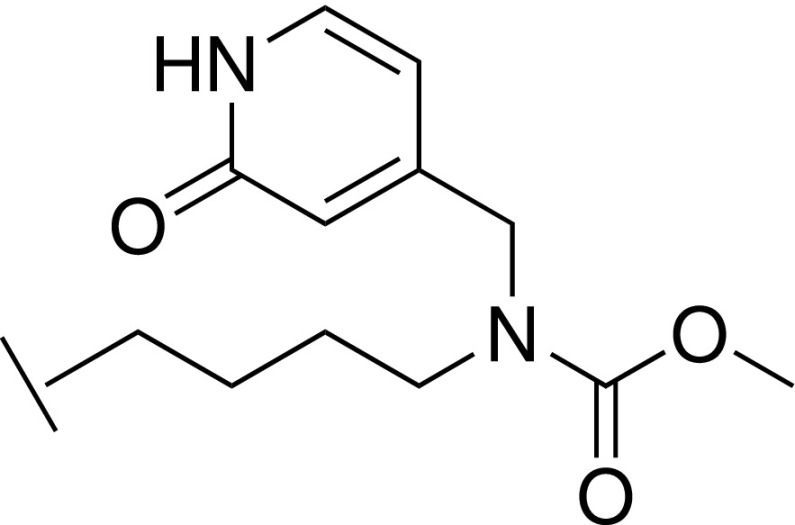
SAR of derivatives of 2.

graphic file with name SDTYAE-000006-064701_1-gd30.jpg
Compound R KD (μM)a
13 graphic file with name SDTYAE-000006-064701_1-gd11.jpg > 3000
14 graphic file with name SDTYAE-000006-064701_1-gd12.jpg 530b
15 graphic file with name SDTYAE-000006-064701_1-gd13.jpg 300 ± 40
16 graphic file with name SDTYAE-000006-064701_1-gd14.jpg 140 ± 30
17 graphic file with name SDTYAE-000006-064701_1-gd15.jpg 22 ± 6
23 graphic file with name SDTYAE-000006-064701_1-gd16.jpg 890b
24 graphic file with name SDTYAE-000006-064701_1-gd17.jpg 240 ± 10
28 graphic file with name SDTYAE-000006-064701_1-gd18.jpg 350 ± 40
29 graphic file with name SDTYAE-000006-064701_1-gd19.jpg 200 ± 10
30 graphic file with name SDTYAE-000006-064701_1-gd20.jpg 12 ± 1
31 graphic file with name SDTYAE-000006-064701_1-gd21.jpg 25 ± 3
32 graphic file with name SDTYAE-000006-064701_1-gd22.jpg 28.9 ± 0.5
35 graphic file with name SDTYAE-000006-064701_1-gd23.jpg 11 ± 1
37 graphic file with name SDTYAE-000006-064701_1-gd24.jpg 4.5 ± 0.3
40 graphic file with name SDTYAE-000006-064701_1-gd25.jpg 19 ± 3
45 graphic file with name SDTYAE-000006-064701_1-gd26.jpg 98.6 ± 0.6
47 graphic file with name SDTYAE-000006-064701_1-gd27.jpg 24.2 ± 0.2
a

mean ± SE.

b

SE not reported (n = 1).