
Figure 1.
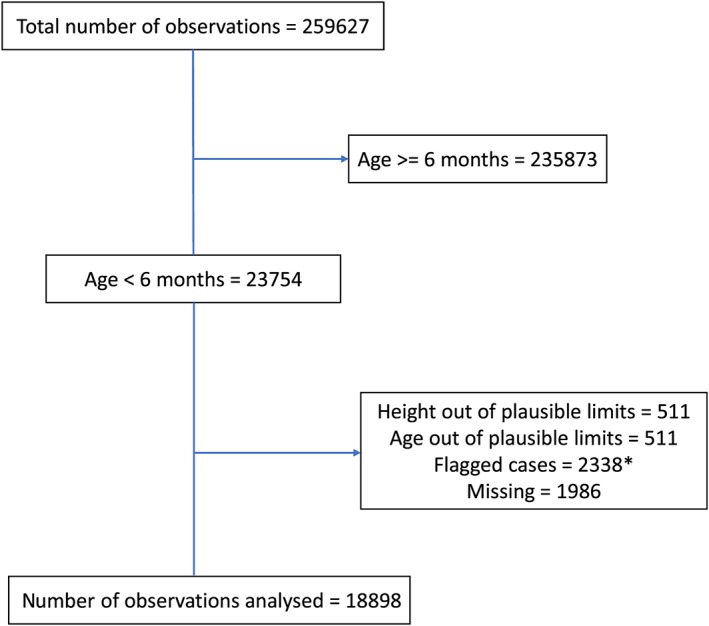
Flowchart showing number of observations analysed and reasons for exclusion (IAKR73FL.dta, National Family Health Survey‐4, 2015–2016)
Official websites use .gov
A
.gov website belongs to an official
government organization in the United States.
Secure .gov websites use HTTPS
A lock (
) or https:// means you've safely
connected to the .gov website. Share sensitive
information only on official, secure websites.
Flowchart showing number of observations analysed and reasons for exclusion (IAKR73FL.dta, National Family Health Survey‐4, 2015–2016)