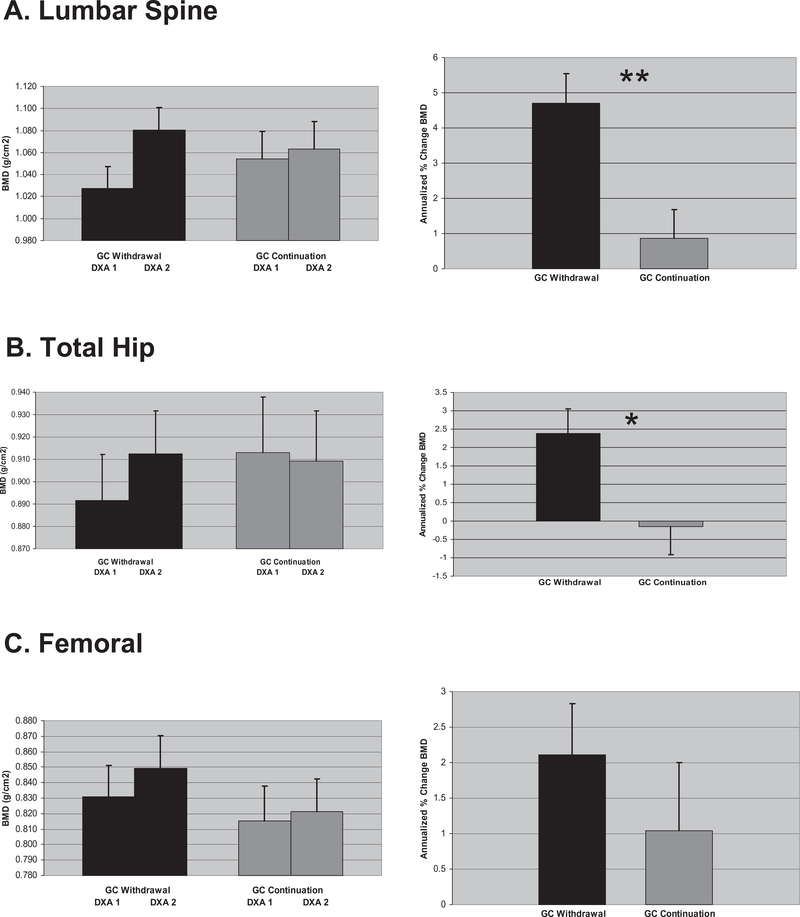
Fig. 1.
Summary of bone mineral density (BMD) and annualized change in BMD by anatomic site. (A) Lumbar spine, (B) total hip, (C) femoral neck. Left panel: Observed mean standardized BMD (g/cm2) in glucocorticoid (GC) withdrawal and continuation at baseline (DXA1) and follow up (DXA2). Right panel: Mean annualized percent change in sBMD in GC withdrawal and continuation. Error bars denote standard error. Asterisks summarize results of t-tests of group differences. *p = 0.01, **p = 0.001. DXA, dual-energy X-ray absorptiometry.

