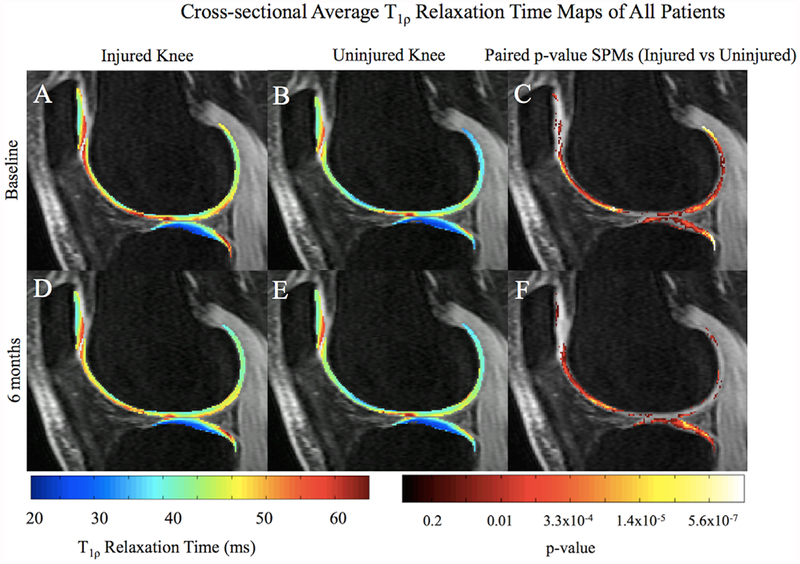
Figure 1.
Average cross-sectional T1ρ SPMs of all patients overlaid onto registered image. Paired p-value SPMs (C and F) show significant differences between injured and uninjured knees at both time points, with a threshold set at p < 0.05. The most posterior aspect of the pLT exhibits a highly focused region with elevated T1ρ values (A–C), becoming more diffuse and anterior after 6 months (D–F).

