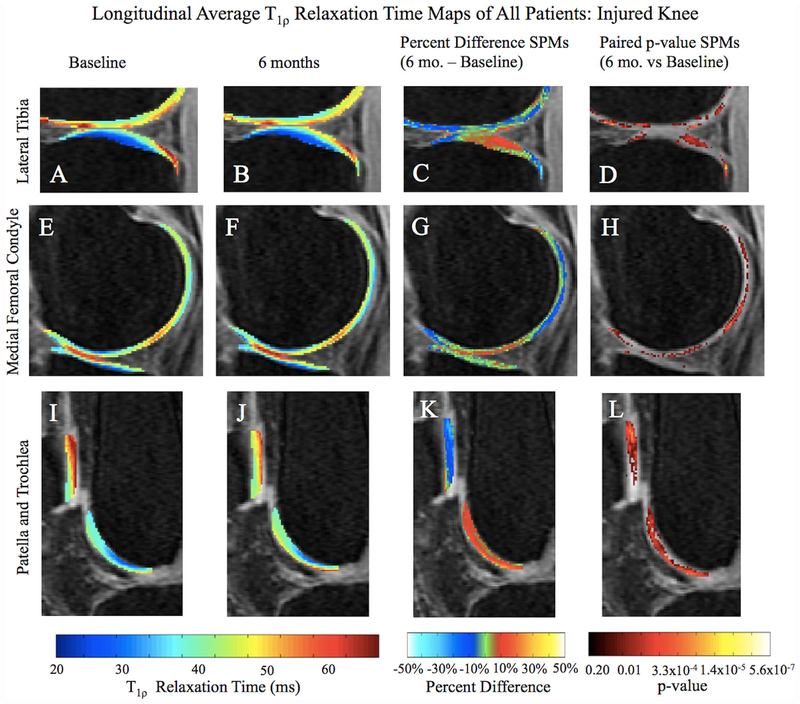
Figure 2.
Average longitudinal T1ρ SPM of all patients overlaid onto registered image. Paired p-value with a threshold set at p < 0.05 and Percent Difference SPMs (C, D, G, H, K, and L) show regions of significant differences between baseline and 6-month T1ρ relaxation times, particularly in the pLT, posterior MF, patella, and superficial trochlea. In the Percent Difference SPMs, red regions indicate higher T1ρ times at 6 months, while blue regions indicate lower T1ρ times at 6 months.

