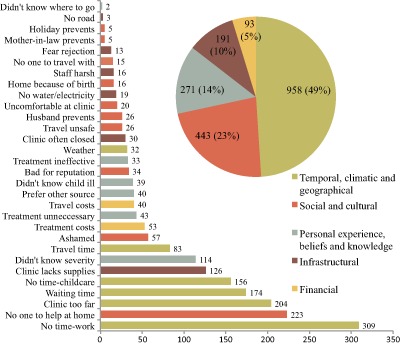
Figure 1.

Barriers to accessing health services for children in Marsabit County, Kenya.
The 30 unique responses are named on the Y‐axis; the number of times that each response was given is shown to the right of the bars. Responses were categorized according to an adapted framework for access by Barton (2010). The total number of responses in each category is depicted in the pie chart.
