
Figure 1.
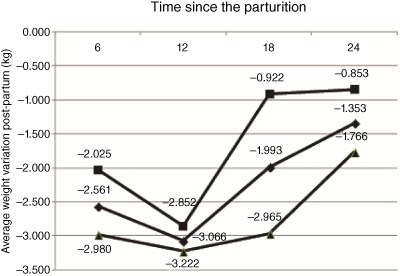
Average weight change post‐partum by duration and intensity of breastfeeding at 6, 12, 18 and 24 months post‐partum (Mutuípe/Laje, 2005–2008). (■) Breastfeeding duration and intensity below the median (n = 124, SD = 4.84; n = 110, SD = 5.71; n = 129 SD = 6.34 and n = 128, SD = 6.63 at 6, up to 12, 18 and 24 months, respectively). (▴) Breastfeeding duration and intensity above the median (n = 159 SD = 4.34; n = 151 SD = 4.62; n = 142, SD = 4.00 and n = 155, SD = 4.50 at 6, up to 12, 18 and 24 months, respectively). t‐Test for equality of means for comparisons between weight change average according breastfeeding scores below and above the median for 6 (P = 0.08), 12 (P = 0.56), 18 (P < 0.01) and 24 (P = 0.17) months post‐partum. (♦) Paired t‐test (P = 0.01) for comparisons between weight average for different periods of the study the exception of the comparison between 6 and 18 months (P = 0.07).