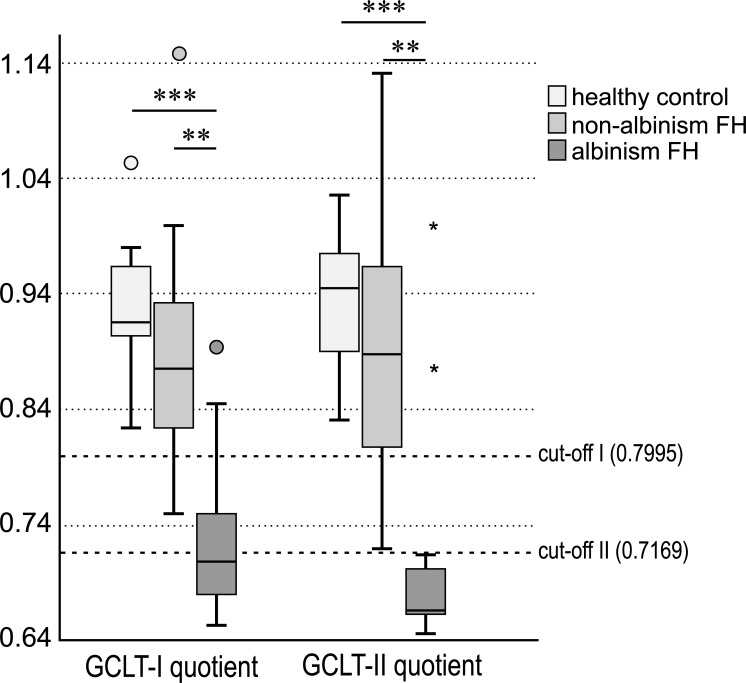
Fig 4. GCLT-I- and GCLT-II-Quotient in healthy controls, non-albinism foveal hypoplasia and albinism FH, significant differences are connected by lines and marked with stars (p< 0.001 = ***; p<0.01 = **).
Optimal cut-offs for distinguishing between the albinism FH and non-albinism FH groups for GCLT-I- and GCLT-II-Quotient (0.7995 and 0.7169) are drawn as a reference line to the x-axis.

