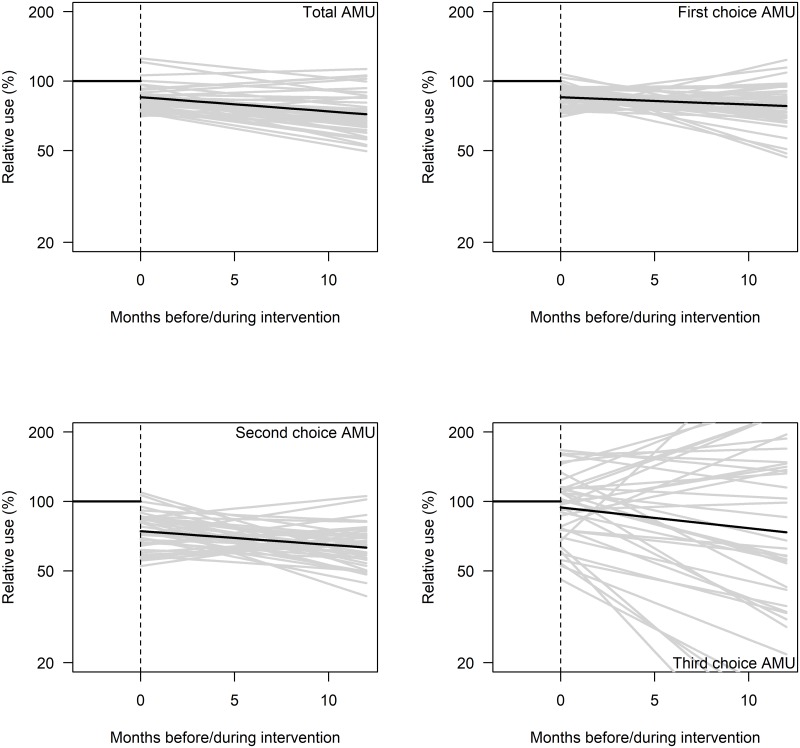
Fig 2. Average and clinic-specific effects of the ASP on total, 1st, 2nd and 3rd choice AMU.
Combined effect of participation in the ASP (stepwise change & change in time trend) are shown for the average effect (black) and for each individual clinic (grey) after standardisation to the estimated AMU before the intervention period (as 100%).

