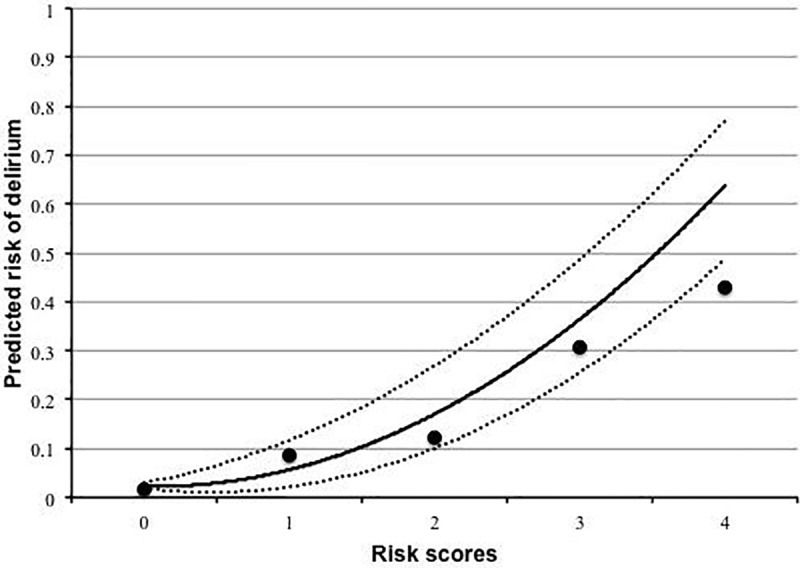
Fig 2. The relationship between risk score and predicted probability.

Dots represent observed delirium (%), the curve, predicted delirium (%); the dotted curves, the 95% confidence interval; the horizontal axis, the risk scores.

Dots represent observed delirium (%), the curve, predicted delirium (%); the dotted curves, the 95% confidence interval; the horizontal axis, the risk scores.