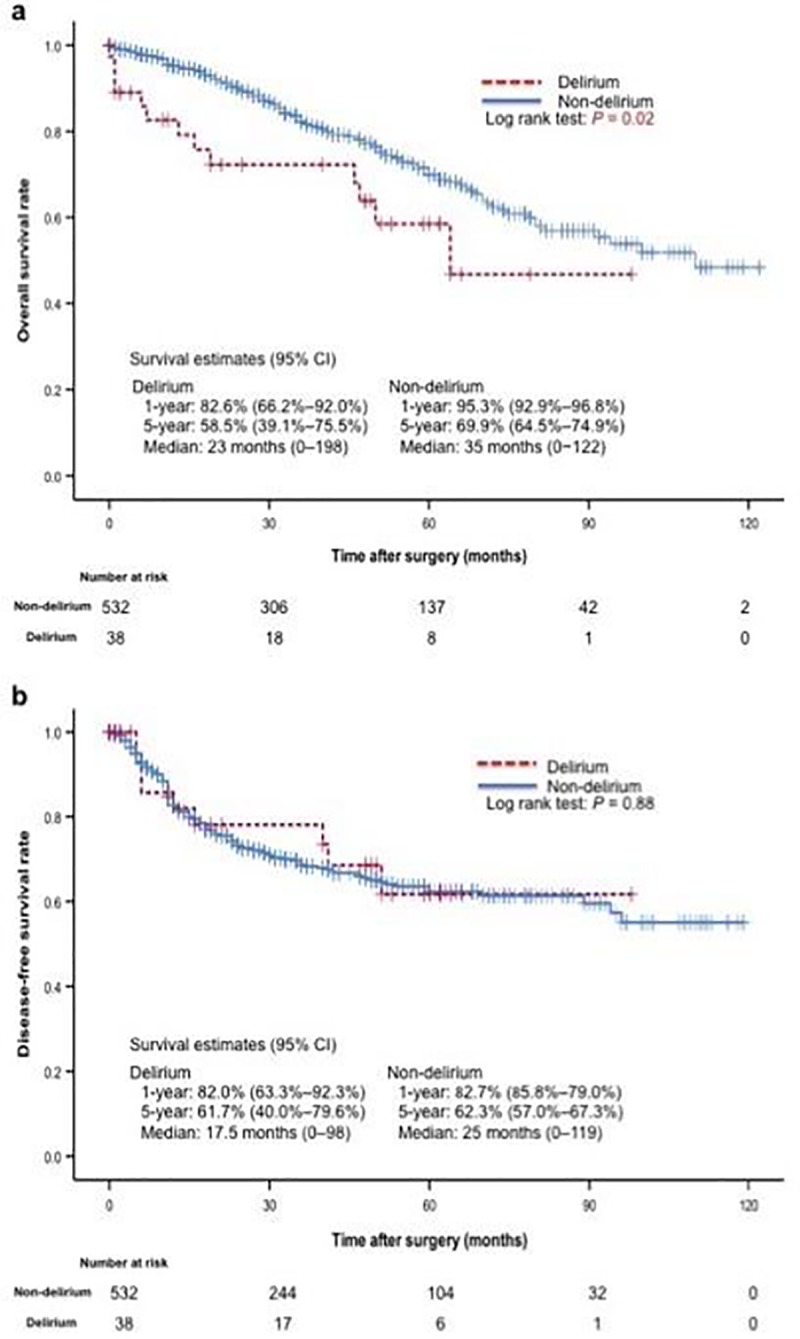
Fig 3.

Kaplan–Meier Curves for Overall Survival (a) and Disease-Free Survival (b) for the Delirium Group and the Non-delirium Group. Although the overall survival rate was significantly lower in the delirium group, there was no significant difference between the two groups in the disease-free survival period. CI, confidence interval.
