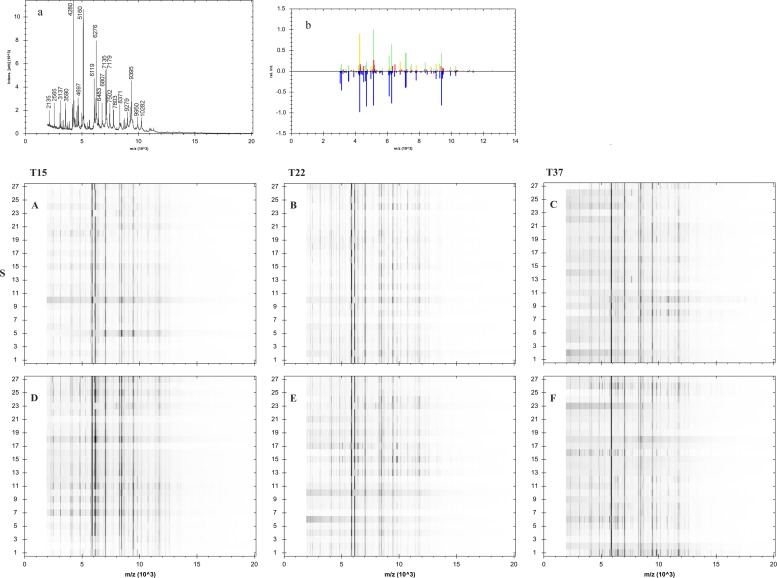
Fig 1. Gelview of signatures obtained from analysis of 27 strains of Vibrio anguillarum grown on different media, characterized by mass/charge ratio peak (m/z) and frequency of appearance in respect of the supplementation of TSA medium with sodium chloride.
Shown is the representative spectrum of V. anguillarum. The gel view was obtained using MALDI Biotyper 3.0 by displaying a pseudo-gel representation of spectra. Peak intensities were gray-scaled with abscissa values as mass to charge ratios (m/z) and spectral numbers as the ordinates.Abbreviations: T15, T22, T37 = temperatures of incubation: 15°C, 22°C, 37°C; S = NaCl-supplemented TSA medium; A-F = strains identified at their first growth on respective medium: A = incubated at 15°C for 48h, B = at 22°C for 48, C = at 37°C for 48h, D = at 15°C for 48h, E = at 22°C for 48h, and F = at 37°C for 48h; a = representative mass spectra, b = mirror view of the best match against the Bruker database.

