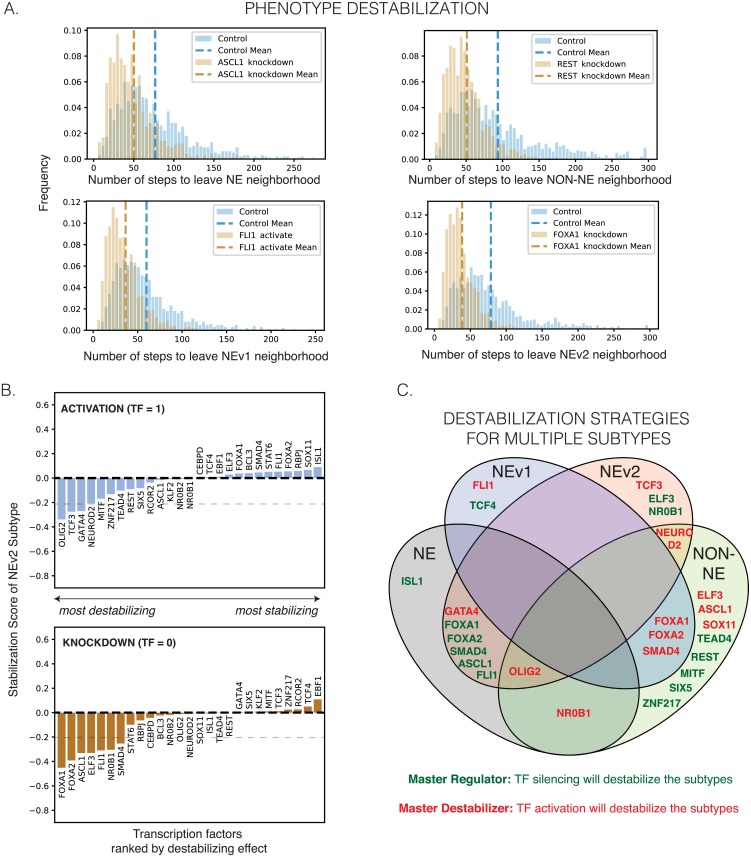
Fig 8. Destabilization of subtypes by perturbation to network.
A. Random walks starting from the attractors in Fig 7C will eventually leave the start state due to uncertainty in the Boolean rules. Control histogram shows how many random steps are required to reach a state with a Hamming distance ≥ 4 under the network’s natural dynamics. The knockdowns and activations shown here hold expression of the perturbed gene OFF or ON in an attempt to destabilize the start state, such that the random walk leaves the neighborhood sooner. A shift to the left in the perturbed distribution signifies that the perturbation “pushed” the simulated cell out of the 4-TF neighborhood more quickly, and the perturbation thus “destabilized” the subtype represented by the start state. This indeed occurs for several perturbations, shown for NE, NEv1, NEv2, and non-NE starting states. Dotted line shows mean for each histogram, which is used to calculate the change in average number of steps under perturbation. B. Ranking of phenotype stabilization of NEv2 by TF activation and knockdown. The percent change of stability measures the percent change in the average number of steps needed to leave the neighborhood of the stable states. Negative stabilization scores indicates destabilizing perturbations, while positive indicates increasing stability. Results are shown for 1000 iterations starting from NEv2. Similar plots for the other subtypes can be found in S8 Fig. Dotted line at y = −0.2 signifies the cutoff for “destabilizing” perturbations shown in C. C. A Venn diagram demonstrating overlap of destabilization strategies. A single activation (green text) or knockdown (red text) can sometimes destabilize multiple phenotypes.

